


What is the EV/EBITA Ratio?
EV / EBITA is a financial metric used to evaluate a company’s overall value in relation to its operating performance. This ratio compares a company’s Enterprise Value (EV) to its Earnings Before Interest, Taxes, and Amortization (EBITA).
EV represents the total value of a company, including its equity, debt, and excluding cash and cash equivalents. EBITA, on the other hand, is a measure of a company’s profitability that focuses on its core operations by excluding interest, taxes, and amortization.
How to Calculate EV/EBITA?
The formula for calculating EV / EBITA is straightforward:
EV / EBITA = Enterprise Value (EV) / Earnings Before Interest, Taxes, and Amortization (EBITA)
In this formula:
Enterprise Value: It is the total value of a company, which includes market capitalization (the total value of all outstanding shares of stock) plus debt, minus cash and cash equivalents.
EV = Market Cap + Debt − Cash
EBITA: This can be found on a company’s income statement, or it can be calculated by adding back interest, taxes, and amortization to the net income.
EBITA = Net Income + Interest Expense + Taxes + Amortization

Example Calculation of EV/EBITA
Consider analyzing a company in the manufacturing sector.
First, we need to calculate the Enterprise Value (EV), which is the total value of the company, including its market capitalization (equity), debt, and cash. Here’s the breakdown of the relevant information:
- Market Capitalization (Market Cap): $500,000,000
- Debt: $100,000,000
- Cash and Cash Equivalents: $30,000,000
EV = Market Cap + Debt − Cash
EV = 500,000,000 + 100,000,000 − 30,000,000 = 570,000,000
So, the Enterprise Value (EV) of the company is $570,000,000.
Next, we need to find EBITA. Let’s assume the company reports the following figures in its income statement:
- Net Income: $50,000,000
- Interest Expense: $10,000,000
- Taxes: $15,000,000
- Amortization: $5,000,000
The formula to calculate EBITA is:
EBITA = Net Income + Interest Expense + Taxes + Amortization
EBITA = 50,000,000 + 10,000,000 + 15,000,000 + 5,000,000 = 80,000,000
So, the EBITA of the company is $80,000,000.
Now, calculating the EV/EBITA ratio:
EV / EBITA = Enterprise Value / EBITA = 570,000,000 / 80,000,000
EV / EBITA = 7.125
Thus, the EV / EBITA ratio is 7.125. This means that the company is valued at approximately 7.13 times its EBITA.
Why is EV/EBITA Important?
The EV/EBITA ratio provides insights into how much investors are paying for a company’s earnings capacity, helping them make informed decisions about buying or selling shares. The ratio’s usefulness extends to comparing companies within the same industry, identifying potential acquisition targets, and determining the financial health of a business.
Here are several reasons why this metric is important:
- Valuation Measure: It helps investors assess whether a company is overvalued or undervalued compared to its earnings power. A lower ratio may suggest that the company is undervalued, while a higher ratio could indicate overvaluation.
- Comparative Analysis: EV / EBITA is often used to compare companies within the same industry or sector. Since it adjusts for differences in capital structure (such as varying levels of debt), it provides a more accurate comparison of operational efficiency across companies.
- Excludes Non-Operational Costs: By excluding interest, taxes, and amortization, this ratio focuses purely on a company’s core operations, offering investors a cleaner view of a company’s profitability.
- Useful in Mergers and Acquisitions (M&A): In M&A scenarios, EV / EBITA helps assess how much an acquiring company is paying for a target’s earnings capacity. A lower EV / EBITA may suggest a more attractive acquisition price.
How to Interpret the EV/EBITA Ratio?
If the EV / EBITA ratio is relatively low, it could indicate that the company is undervalued compared to its operational earnings, suggesting it may be a potentially good investment opportunity, especially if the industry average is higher.
A higher ratio would generally suggest that the company is valued at a premium relative to its earnings, possibly due to growth expectations or an overinflated market perception.
What is a Good EV/EBITA?
Determining what constitutes a good or bad EV / EBITA ratio depends on several factors, including industry, company maturity, and market conditions. Here are some general guidelines:
Lower Ratios: Generally, a lower EV / EBITA ratio (e.g., below 10) is considered a sign of undervaluation. It suggests that the company is priced cheaply relative to its earnings, which could represent a buying opportunity.
Higher Ratios: A higher ratio (e.g., above 15) might indicate that a company is overvalued or that investors are willing to pay a premium for future growth. However, this is not necessarily a red flag, as certain industries or companies may justify a higher multiple.
Industry Standards: The EV / EBITA ratio varies across industries. For instance, tech companies with high growth potential may have a higher ratio, while traditional industries like utilities may have a lower ratio. Comparing the ratio to industry peers is often the best way to assess a company’s valuation.
Limitations of EV/EBITA
While the EV / EBITA ratio is a useful tool, it does have limitations that investors should be aware of:
- Ignores Capital Expenditures: The metric does not consider capital expenditures (CapEx), which can significantly affect a company’s cash flow. For capital-intensive industries, this can be a major drawback.
- Not Ideal for High-Growth Companies: EV / EBITA is more suitable for established, stable companies. High-growth companies, especially in tech or biotech, may have lower EBITA due to heavy reinvestment in growth, making this ratio less relevant.
- Excludes Non-Cash Items: While excluding amortization provides a clearer view of core operations, it ignores potential impacts from other non-cash items that might affect a company’s overall financial position.
- Varying Accounting Practices: EBITA can be calculated differently depending on a company’s accounting policies, making comparisons between companies tricky if the metric is calculated inconsistently.
How to Find the EV/EBITA Ratio?
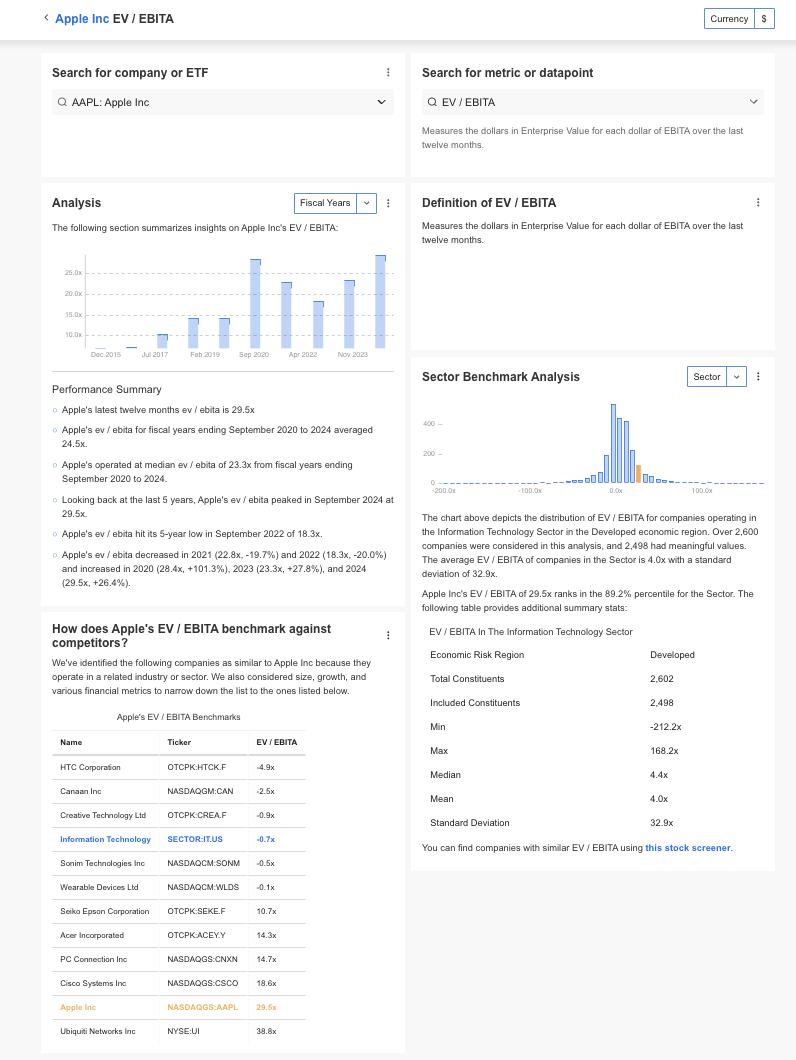
InvestingPro offers detailed insights into companies’ EV/EBITA including sector benchmarks and competitor analysis.
InvestingPro: Access EV-to-EBITA Ratio Data Instantly
Unlock Premium Data With InvestingPro 📈💸
Gain instant access to EV-to-EBITA Ratio data within the InvestingPro platform
🛠 Access to 1200+ additional fundamental metrics
🔍 Competitor comparison tools
📊 Evaluate stocks with 14+ proven financial models
EV / EBITA FAQs
What is the difference between EV / EBITA and P/E ratio?
The P/E ratio focuses on price relative to earnings after interest, taxes, and amortization. In contrast, EV / EBITA compares a company’s overall value to its operating earnings, providing a clearer picture of value when capital structures differ.
How does a high EV / EBITA ratio affect investors?
A high EV / EBITA ratio could indicate that the stock is overvalued, meaning investors might be paying more for the company relative to its earnings, which could lead to lower returns.
Can the EV / EBITA ratio be used in all industries?
While the ratio is widely applicable, it’s most useful for industries with stable earnings and predictable cash flows. It’s less relevant for high-growth sectors, where profitability might not be stable.
How does EV / EBITA affect M&A decisions?
In mergers and acquisitions, the EV / EBITA ratio helps determine the price-to-earnings multiple an acquirer is willing to pay, helping assess whether the target company is worth the investment.


