What is Dividend CAGR?
Dividend CAGR, or Dividend Compound Annual Growth Rate, measures the annualized growth rate of dividends over a specified period. It provides a clear picture of how consistently a company increases its dividend payments, helping investors assess its reliability and growth potential. For income-focused investors, Dividend CAGR is a critical metric to evaluate a company’s commitment to returning value to shareholders.
How to Calculate Dividend CAGR?
The formula to calculate Dividend CAGR is as follows:

Dividend CAGR = (Ending Dividend / Starting Dividend) ^ 1/n − 1
In this formula,
- Ending Dividend = Dividend per share at the end of the period.
- Starting Dividend = Dividend per share at the start of the period.
- n = Number of years.
This formula applies the concept of compound growth, showing how much dividends have grown annually over time.

Example Calculation of Dividend CAGR
Consider the following data for a company:
- Starting Dividend (D₁): $1.50
- Ending Dividend (Dₙ): $2.50
- Number of Years (n): 5
The Dividend CAGR formula is:
Dividend CAGR = (Ending Dividend / Starting Dividend) ^ 1/n − 1
Dividend CAGR = (2.50 / 1.50) ^ ⅕ -1 = 0.108
Dividend CAGR = 0.107 × 100 = 10.7%
The Dividend CAGR is 10.7%. This means that over the 5-year period, the company’s dividend payments grew at an annualized rate of 10.7%.
Why is Dividend CAGR Important?
Dividend CAGR is a key metric for understanding the financial health of a company. It highlights whether a company consistently grows its dividends, reflecting profitability, strong cash flows, and a shareholder-friendly approach.
Here are some reasons why Dividend CAGR is essential:
- Measures Dividend Growth: Dividend CAGR directly quantifies how much a company’s dividend payments grow each year, helping investors identify firms with strong dividend growth histories.
- Signals Financial Stability: Consistently growing dividends indicate robust earnings and stable cash flows, reassuring investors of the company’s financial strength.
- Aligns with Long-Term Goals: Investors focused on wealth creation or retirement planning benefit from companies with high Dividend CAGRs, ensuring compounding income over time.
- Enhances Investment Comparison: Dividend CAGR allows investors to compare companies and sectors to determine which offers better long-term income growth.
- Indicates Management Confidence: Rising dividends often signal management’s confidence in the company’s ongoing profitability and its commitment to shareholder returns.
How to Interpret Dividend CAGR?
Interpreting Dividend CAGR helps investors determine the reliability and attractiveness of a company’s dividend policy. A balanced growth rate, supported by robust earnings and sustainable practices, is ideal for long-term investment strategies.
While a high Dividend CAGR signifies rapid growth in dividend payouts over a specified period, a low Dividend CAGR indicates slower growth in dividend payouts or even stagnation. Here’s how to interpret the metric:
- Higher Dividend CAGR: Suggests strong growth and increasing shareholder value, often reflecting a company’s profitability. However, it requires careful evaluation of its sustainability, as aggressive growth might compromise long-term stability.
- Consistent Dividend CAGR: Implies steady dividend growth, signaling financial reliability. This appeals to conservative investors seeking stable returns without high risk.
- Declining Dividend CAGR: Indicates potential financial difficulties or a shift in company priorities. Investors should assess underlying causes, as it could suggest reduced profitability or a change in dividend policy.
What is a Good Dividend CAGR?
A “good” Dividend CAGR depends on industry norms and investor goals. For instance:
- 5-10% CAGR: Considered strong for mature industries like consumer goods or utilities.
- 10-15% CAGR: Often seen in growth-oriented sectors like technology.
Investors should evaluate whether the Dividend CAGR aligns with their income needs and risk tolerance while considering the company’s financial health and payout sustainability.
What are the Limitations of Dividend CAGR?
While Dividend CAGR is useful, it’s not a standalone measure. Investors must consider its limitations to avoid over-reliance on this metric when evaluating stocks.
- Ignores Dividend Cuts: Dividend CAGR can appear inflated if the calculation starts from a low base following a dividend cut, potentially misleading investors.
- Doesn’t Reflect Payout Ratio: A high Dividend CAGR doesn’t always indicate financial health if the payout ratio (dividends as a percentage of earnings) is unsustainably high.
- Overlooks Industry Cycles: Certain industries, like utilities, may have stable but slow dividend growth, while others, like tech, may reinvest profits instead of paying dividends.
- Sensitive to Time Period: Dividend CAGR calculations can vary significantly based on the selected time frame, potentially distorting trends.
- Not a Forward-Looking Metric: Dividend CAGR reflects past performance, offering limited insight into future growth potential.
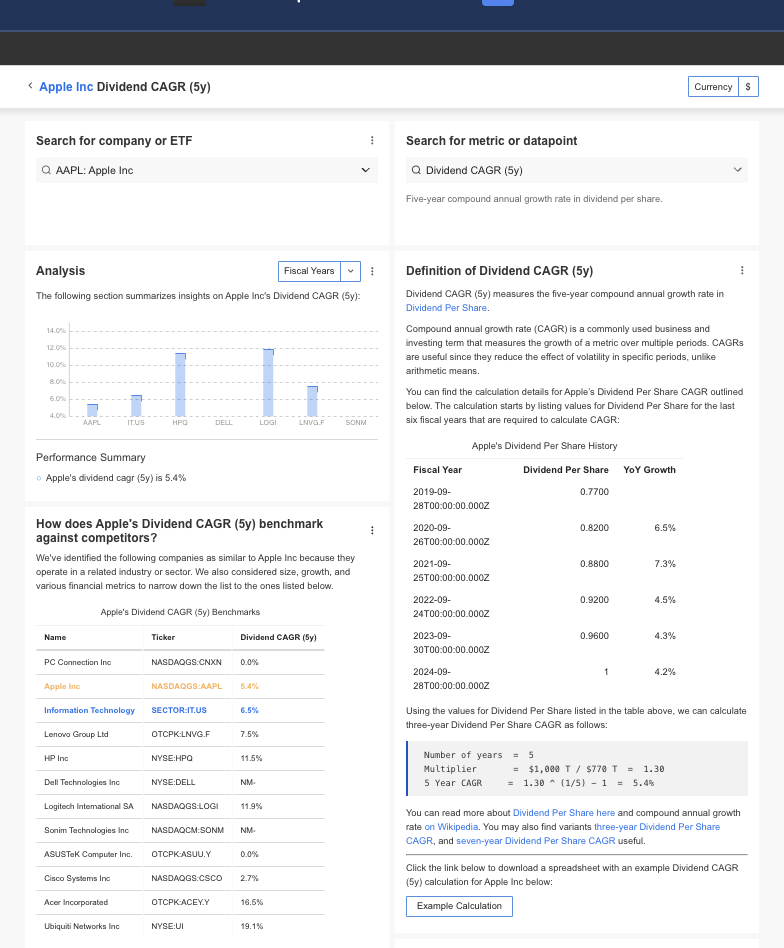
How to Find Dividend CAGR?
InvestingPro offers detailed insights into companies’ Dividend CAGR including sector benchmarks and competitor analysis.
InvestingPro+: Access Dividend CAGR Data Instantly
Unlock Premium Data With InvestingPro 📈💸
Gain instant access to Dividend CAGR data within the InvestingPro platform
🛠 Access to 1200+ additional fundamental metrics
🔍 Competitor comparison tools
📊 Evaluate stocks with 14+ proven financial models
Dividend CAGR FAQ
What does Dividend CAGR reveal about a company?
It shows how much a company’s dividend payments grow annually, highlighting its profitability, cash flow stability, and commitment to shareholder returns.
How is Dividend CAGR different from dividend yield?
Dividend yield measures the annual dividend as a percentage of stock price, while Dividend CAGR focuses on the growth rate of dividend payments over time.
What factors affect Dividend CAGR?
Profit growth, cash flow availability, payout ratio, and management policies all influence a company’s ability to grow dividends consistently.
Can Dividend CAGR be negative?
Yes, a negative Dividend CAGR indicates a decline in dividend payments over the measured period, potentially signaling financial challenges.
How far back should I calculate Dividend CAGR?
A 5-10 year time frame is ideal to capture consistent trends while accounting for market cycles.