


What is Debt-to-EBITDA Ratio?
The Debt-to-EBITDA ratio is a measure of a company’s financial leverage. It compares a company’s total debt (both short-term and long-term) to its EBITDA (earnings before interest, taxes, depreciation, and amortization), which is an indicator of the company’s operational profitability.
By comparing a company’s debt levels to its EBITDA, this ratio highlights the firm’s capacity to manage its debt obligations and indicates its financial health. Essentially, the Debt-to-EBITDA ratio shows how many years it would take for a company to pay off its debt if its EBITDA remained constant and all earnings were directed towards debt repayment.
How to Calculate Debt-to-EBITDA Ratio?
The Debt-to-EBITDA ratio is calculated using the following formula:

Debt-to-EBITDA Ratio = Total Debt / EBITDA
Here,
- Total Debt includes all interest-bearing liabilities, such as loans, bonds, and other forms of borrowing.
- EBITDA is often used to assess a company’s core profitability and cash flow.

Example Calculation of Debt-to-EBITDA Ratio
Company XYZ has the following financial data:
- Total Debt: $1.2 billion
- EBITDA: $400 million
The Debt-to-EBITDA ratio is calculated as:
Debt-to-EBITDA Ratio = 1,200,000,000 / 400,000,000 = 3.0
This means that Company XYZ has three dollars of debt for every dollar of EBITDA, which could indicate moderate leverage.
Why is Debt-to-EBITDA Ratio Important?
This Debt/EBITDA ratio is used by investors and lenders to gauge whether a company is overleveraged or if it has sufficient earnings to cover its debt payments. It serves as an indicator of how easily a company can pay off its incurred debt using its operating earnings. It is particularly useful for assessing businesses that rely heavily on debt for financing.
A higher ratio may indicate that a company is taking on more debt than it can reasonably handle, which could be risky. On the other hand, a lower ratio may suggest that the company is using its debt more responsibly, or that it has strong earning power relative to its debt obligations.
Here are key uses of the financial metric:
Assessing Financial Health: The Debt-to-EBITDA ratio helps assess a company’s financial health, showing whether it is overleveraged or if it can comfortably service its debt. Companies with a low ratio are typically seen as less risky to investors and lenders, as they have lower debt obligations relative to their earnings.
Investor and Lender Confidence: Investors and lenders rely on the Debt-to-EBITDA ratio to evaluate the risk of a company. A low ratio might signal that the company is not taking on excessive debt, which can enhance investor confidence. Conversely, a high ratio could make it more difficult for the company to secure funding or attract investment.
Benchmarking: Companies can use the Debt-to-EBITDA ratio to benchmark themselves against industry peers. By comparing their ratio to that of similar companies, firms can understand where they stand in terms of debt levels and profitability.
How to Interpret the Debt-to-EBITDA Ratio?
The Debt-to-EBITDA ratio is expressed as a multiple, which reflects the number of years it would take a company to pay off its debt using its current EBITDA.
For instance, if a company has a Debt-to-EBITDA ratio of 3, it means the company would take three years of its earnings (before interest, taxes, depreciation, and amortization) to pay off its debt.
A lower Debt-to-EBITDA ratio generally indicates that a company is less leveraged and, therefore, might be in a better position to weather economic downturns. Conversely, a higher ratio may suggest that the company is over-leveraged and could face challenges in repaying its debts, especially if earnings are volatile.
Here’s a general guideline for interpreting the ratio:
Low Debt-to-EBITDA Ratio (Less than 3): A lower ratio is often seen as a sign of financial strength, as it indicates that the company is not overly reliant on debt. A ratio below 3 is typically considered healthy, especially in industries with stable cash flows.
Moderate Debt-to-EBITDA Ratio (Between 3 and 5): A ratio in this range indicates that a company is carrying a moderate amount of debt relative to its earnings. This could be typical for industries requiring significant capital investment, such as telecommunications and utilities.
High Debt-to-EBITDA Ratio (Above 5): A high ratio suggests that a company is carrying a significant amount of debt compared to its earnings. This can be a red flag for investors and creditors, as it implies the company may struggle to repay its debts, particularly if there is an economic downturn or a decline in earnings.
Factors Affecting the Debt-to-EBITDA Ratio
Several factors can influence a company’s Debt-to-EBITDA ratio, including:
Industry Norms: Different industries have varying standards for what constitutes a healthy Debt-to-EBITDA ratio. Capital-intensive industries such as telecommunications and energy often carry higher debt loads, while tech or service-based companies typically have lower ratios.
Economic Conditions: During periods of economic expansion, companies might take on more debt to finance growth, leading to a higher Debt-to-EBITDA ratio. Conversely, during economic downturns, companies may work to reduce debt and improve their balance sheets.
Company’s Capital Structure: Companies that rely heavily on debt for financing, rather than equity, will have higher Debt-to-EBITDA ratios. Conversely, companies that prefer equity financing will often have lower ratios.
Profitability and Cash Flow: Companies with stable and strong EBITDA are better positioned to handle higher debt levels, as their earnings provide a cushion for debt repayment.
Debt-to-EBITDA Ratio in Credit Analysis
In credit analysis, the Debt-to-EBITDA ratio is a key metric used by rating agencies, banks, and investors to assess the likelihood that a company can repay its debt. It is an important indicator of the company’s ability to generate enough earnings to cover interest payments and repay principal.
A company with a higher ratio may be viewed as riskier, especially in an environment of rising interest rates or economic instability.
Debt-to-EBITDA Ratio in Mergers and Acquisitions
In mergers and acquisitions (M&A), the Debt-to-EBITDA ratio is often used to assess the risk associated with taking on additional debt. Companies undergoing acquisitions may use this ratio to determine whether they can handle the debt that will be incurred from the transaction.
A high Debt-to-EBITDA ratio in an acquisition target might make the deal less attractive, as the acquiring company could struggle with debt repayment.
Limitations of the Debt-to-EBITDA Ratio
The Debt-to-EBITDA ratio is favored for its simplicity, as both debt and EBITDA are easily sourced from financial statements. However, it may not fully capture a company’s financial reality. While EBITDA excludes non-cash expenses like depreciation and amortization, it can be manipulated to mask losses, leading to an incomplete picture of profitability.
Additionally, the ratio overlooks interest expenses, which can be significant for companies with high debt levels. Investors should consider interest costs separately to assess a company’s true ability to meet its debt obligations.
The ratio’s relevance also varies by industry. Capital-intensive sectors may have higher Debt-to-EBITDA ratios, with a ratio of 10 being normal in some industries, while others may operate with lower ratios, such as 3 to 4. Therefore, comparisons across industries should be made cautiously to avoid misleading conclusions.
How to Find Debt-to-EBITDA Ratio?
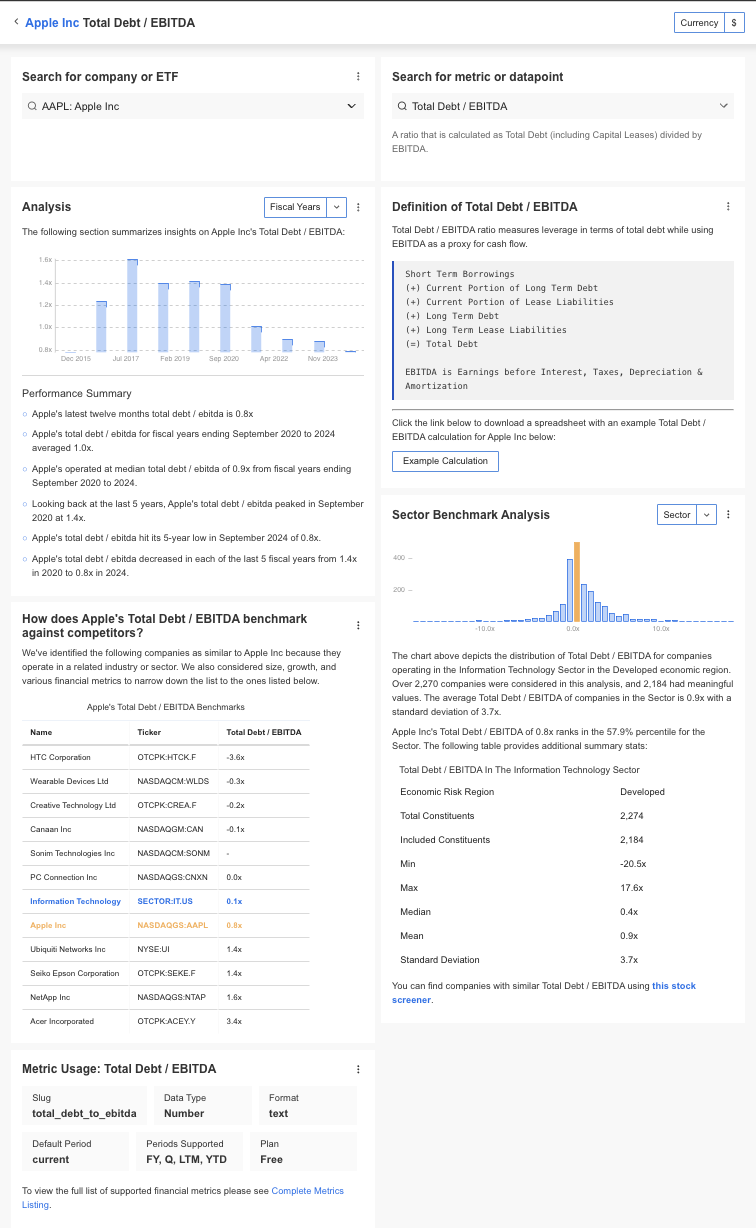
InvestingPro offers detailed insights into companies’ Debt-to-EBITDA ratio including sector benchmarks and competitor analysis.
InvestingPro: Access Debt-to-EBITDA Ratio Data Instantly
Unlock Premium Data With InvestingPro 📈💸
Gain instant access to Debt-to-EBITDA Ratio data within the InvestingPro platform
🛠️ Access to 1200+ additional fundamental metrics
🔎 Competitor comparison tools
📊 Evaluate stocks with 14+ proven financial models
Debt-to-EBITDA Ratio FAQs
What does the Debt-to-EBITDA ratio measure?
The Debt-to-EBITDA ratio measures a company’s ability to repay its debt by comparing total debt to earnings before interest, taxes, depreciation, and amortization (EBITDA).
What is considered a healthy Debt-to-EBITDA ratio?
A Debt-to-EBITDA ratio below 3 is generally considered healthy, indicating that a company can comfortably manage its debt. Ratios between 3 and 5 are moderate, while ratios above 5 may indicate potential financial risk.
How can the Debt-to-EBITDA ratio be used by investors?
Investors use the Debt-to-EBITDA ratio to assess the financial risk of a company. A lower ratio suggests lower risk, while a higher ratio might indicate the company is over-leveraged.
What factors can affect the Debt-to-EBITDA ratio?
Industry norms, economic conditions, capital structure, and a company’s profitability can all affect the Debt-to-EBITDA ratio. Companies in capital-intensive industries typically have higher ratios.
How does the Debt-to-EBITDA ratio compare to the Debt-to-Equity ratio?
The Debt-to-EBITDA ratio focuses on a company’s earnings relative to its debt, while the Debt-to-Equity ratio compares total debt to equity. Both ratios assess financial risk but in different ways.


