What is Daily High?
The Daily High is the highest price at which a financial asset, such as a stock, commodity, or currency, trades during a single trading session. This metric reflects the peak level of market interest and demand for the asset on that day. The Daily High is crucial for identifying price trends, market sentiment, and potential trading opportunities.
Investors and traders often pair the Daily High with the Daily Low to analyze the asset’s price range and volatility, providing insights into intraday market dynamics.
How to Calculate Daily High?
Calculating the Daily High is straightforward. It involves identifying the maximum price of the asset during the trading session. Most trading platforms automatically display this value, but it can also be tracked manually using market data.

Daily High = max (Price of Asset at Time 1, Time 2, … Time N)
In this formula, N represents all the trading intervals within the session.
Example Calculation of Daily High
Consider the following intraday prices of a stock:
- 10:00 AM: $50
- 11:00 AM: $52
- 12:00 PM: $51
- 1:00 PM: $53 (Highest)
- 2:00 PM: $50
In this scenario, the Daily High is $53, recorded at 1:00 PM.
Why is Daily High Important?
The Daily High holds significant value for traders, investors, and analysts as it encapsulates the market’s peak valuation of an asset during a trading session. This metric is not just a number; it represents a blend of market sentiment, trading activity, and demand dynamics that influence the asset’s performance on a given day.
By understanding the Daily High, participants in financial markets can gain insights into the strength of an asset, detect potential trading opportunities, and make informed decisions that align with their strategies.
Here are some reasons why Daily High is essential:
- Identifies Intraday Market Sentiment: The Daily High reflects the maximum willingness of buyers to pay for an asset, offering insights into bullish market behavior during the trading session.
- Supports Technical Analysis: Traders use the Daily High to set resistance levels or determine potential breakout points, aiding in strategy development for market entry or exit.
- Assesses Volatility: By comparing the Daily High with the Daily Low, traders can measure price volatility, which is crucial for risk management and decision-making.
- Guides Intraday Strategies: Day traders rely on the Daily High to identify trading opportunities, particularly in momentum or breakout scenarios.
- Tracks Historical Performance: Monitoring Daily Highs over time helps traders identify patterns or trends, which can be indicative of future market movements.
How to Interpret Daily High?
The Daily High holds different implications depending on the market context:
- Uptrend Markets: A rising Daily High over consecutive days may indicate a strong bullish trend, signaling opportunities for buying.
- Range-Bound Markets: In a consolidating market, the Daily High serves as a resistance level, helping traders set sell orders or stop-loss points.
- Downtrend Markets: A falling Daily High can signal weakening buyer interest, which may indicate bearish sentiment or caution.
It’s essential to interpret the Daily High alongside other indicators, such as trading volume and technical patterns, to make informed decisions.
What is a Good Daily High?
A “good” Daily High depends on the context:
- For bullish traders, a rising Daily High coupled with strong volume may indicate robust market interest and growth potential.
- For range traders, a consistent Daily High within a predictable range offers stability for strategy execution.
Ultimately, a good Daily High aligns with the trader’s specific goals, market strategy, and risk tolerance. Comparing the Daily High to historical highs and lows can provide additional insights.
What are the Limitations of Daily High?
While the Daily High is a valuable metric for assessing an asset’s peak price during a trading session, it is not without its shortcomings. The figure represents only a snapshot of market activity and may lack the depth required for a comprehensive analysis. Relying solely on the Daily High can lead to misinterpretations, especially in volatile or irregular markets.
To make well-informed decisions, traders and investors must understand the limitations of the Daily High and complement it with other indicators and analysis tools.
Does Not Reflect Long-Term Trends
The Daily High is limited to intraday data and may not provide insights into the broader market trend or fundamental value of an asset.
Influenced by Market Noise
Sudden spikes caused by rumors or short-term events can inflate the Daily High, leading to misleading signals for traders.
Limited in Isolation
Without context from other metrics like volume or Daily Low, the Daily High alone may not offer a complete picture of market conditions.
Prone to Overreaction
Traders may overemphasize the Daily High, especially in volatile markets, potentially leading to hasty or ill-informed trading decisions.
No Guarantee of Future Performance
A high Daily High does not necessarily indicate future growth or sustained demand for the asset, particularly if driven by speculative trading.
How to Find Daily High?
InvestingPro offers detailed insights into companies’ Daily High including sector benchmarks and competitor analysis.
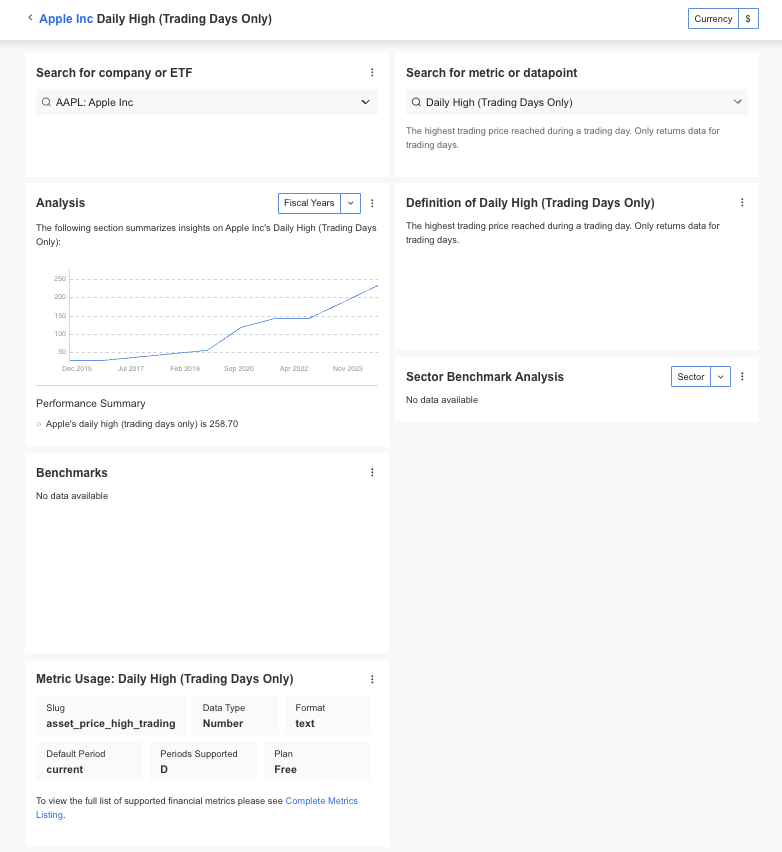
InvestingPro+: Access Daily High Data Instantly
Unlock Premium Data With InvestingPro 📈💸
Gain instant access to Daily High data within the InvestingPro platform
🛠 Access to 1200+ additional fundamental metrics
🔍 Competitor comparison tools
📊 Evaluate stocks with 14+ proven financial models
Daily High FAQ
What does the Daily High represent?
The Daily High is the highest price an asset reaches during a trading day, reflecting peak market interest or demand during that session.
How is the Daily High used in trading?
Traders use the Daily High to identify resistance levels, assess market sentiment, and develop strategies like breakout trading or setting stop-loss orders.
Can the Daily High predict future prices?
No, the Daily High is a backward-looking metric and should be combined with other indicators to assess future price movements.
What causes sudden changes in the Daily High?
Changes in the Daily High can be driven by news events, market sentiment shifts, or high trading volume during specific periods of the day.
Is the Daily High the same for all traders?
Yes, the Daily High is determined by market-wide trading activity and remains consistent across platforms tracking the same asset.