


What is COGS Margin?
The COGS Margin (Cost of Goods Sold Margin) is a financial metric that represents the percentage of revenue consumed by the cost of producing goods or services. It highlights the direct expenses involved in generating sales and serves as a critical indicator of operational efficiency.
How to Calculate COGS Margin?
The COGS Margin is calculated using the following formula:

COGS Margin (%) = (Cost of Goods Sold (COGS) / Revenue) × 100
In this formula,
- COGS: Includes direct costs like raw materials, labor, and manufacturing expenses.
- Revenue: The total income generated from sales.

Example Calculation of COGS Margin
Consider a clothing retail company that has the following financial data for the year:
- Revenue: $1,200,000
- Cost of Goods Sold (COGS): $720,000
Using the formula to calculate the COGS Margin:
COGS Margin (%) = (COGS / Revenue) × 100
COGS Margin (%) = (720,000 / 1,200,000) × 100 = 60%
The COGS Margin for the clothing retail company is 60%.
- This means that 60% of the company’s revenue is consumed by the cost of producing the goods it sells.
- The remaining 40% of revenue is available for covering other business expenses, such as marketing, salaries, rent, and profit.
Why is COGS Margin Important?
The Cost of Goods Sold (COGS) Margin is a crucial financial metric that provides significant insights into a company’s operational efficiency and cost management. It is more than just a percentage – it reveals the underlying story of how effectively a business turns revenue into profit by controlling production costs.
Evaluates Cost Efficiency
COGS Margin provides insights into how effectively a company manages its production costs relative to revenue. A lower COGS Margin indicates that the business spends less on producing its goods or services relative to its revenue, showcasing cost-effective operations.
Conversely, a higher COGS Margin suggests that a larger share of revenue is consumed by production costs, which may signal inefficiencies or high input costs.
Guides Pricing Strategy
COGS Margin plays a pivotal role in determining appropriate pricing for products or services. Businesses use this metric to ensure that prices cover the cost of goods sold while maintaining competitiveness in the market, strike a balance between profitability and affordability for customers, and monitor how pricing changes impact margins and overall profitability.
Enhances Cost Control
Analyzing the COGS Margin helps businesses identify areas where cost savings can be achieved. For instance:
- Supply Chain Optimization: Negotiating better terms with suppliers or switching to cost-effective raw materials can reduce COGS.
- Process Improvements: Streamlining production processes, automating tasks, or minimizing waste can improve efficiency and lower costs.
- Outsourcing: Shifting certain production activities to external vendors might result in cost advantages.
By continuously monitoring and managing the COGS Margin, companies can keep production costs in check and boost profitability.
Affects Profitability
The metric directly impacts Gross Profit Margin, as lower COGS leaves more room for profit. It helps assess how much a company earns after accounting for production expenses.
Informs Investment Decisions
Investors and analysts use COGS Margin to evaluate a company’s operational health and scalability. A consistently high margin may signal inefficiency or poor cost management.
How to Interpret COGS Margin?
Interpreting the COGS margin effectively is crucial for understanding a company’s operational efficiency, profitability, and overall financial health.
Lower COGS Margin
- Indicates efficient cost management and higher profitability.
- Often seen in industries with streamlined production processes or economies of scale.
Higher COGS Margin
- Suggests a higher proportion of revenue is consumed by production costs.
- Could indicate rising raw material costs, inefficient processes, or intense price competition.
Industry-Specific Benchmarks
It’s crucial to compare COGS Margins within the same industry, as norms vary significantly. For instance:
- Retail: Typically higher margins due to inventory costs.
- Software-as-a-Service (SaaS): Lower margins due to minimal production costs.
What is a Good COGS Margin?
A “good” COGS Margin depends on the industry and the company’s operating model.
- Retail: Margins typically range from 60% to 70%.
- Manufacturing: Margins around 50% are common, with efficiency being a key determinant.
- Technology: SaaS and tech companies often have margins below 20% due to low direct costs.
Contextual Benchmarking
Always compare a company’s COGS Margin to its historical performance and industry peers to determine whether it is ‘good’.
Limitations of COGS Margin
While COGS Margin is an essential financial metric, it has its own set of limitations. By carefully interpreting and benchmarking this ratio, businesses, investors, and analysts can gain valuable insights into profitability and sustainability. Here are a few of its limitations:
- Excludes Indirect Costs: COGS Margin only considers direct costs and excludes indirect expenses like administrative or marketing costs. This limits its scope in evaluating overall profitability.
- Industry Variability: Benchmarks differ across industries, making cross-sector comparisons less meaningful.
- Vulnerability to Accounting Practices: Variations in how companies account for COGS can distort the metric. For instance, inventory valuation methods (FIFO vs. LIFO) can impact results.
- Ignores Revenue Quality: The metric doesn’t account for the sustainability or growth potential of revenue streams.
- Does Not Reflect Scalability: A favorable COGS Margin doesn’t necessarily mean the company can scale efficiently, as fixed costs and other factors may come into play.
How to Find COGS Margin?
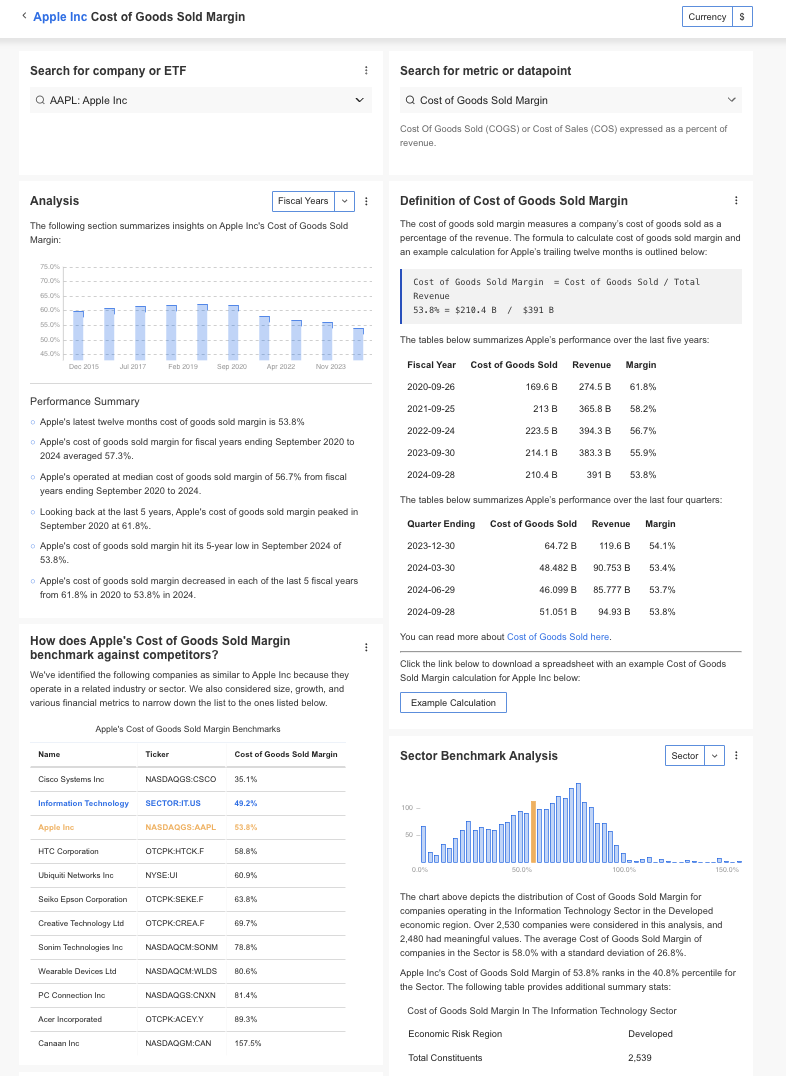
InvestingPro offers detailed insights into companies’ Cost of Goods Sold (COGS) Margin including sector benchmarks and competitor analysis.
InvestingPro+: Access Cost of Goods Sold (COGS) Margin Data Instantly
Unlock Premium Data With InvestingPro 📈💸
Gain instant access to COGS Margin data within the InvestingPro platform
🛠 Access to 1200+ additional fundamental metrics
🔍 Competitor comparison tools
📊 Evaluate stocks with 14+ proven financial models
COGS Margin FAQ
How is COGS different from Operating Expenses?
COGS includes direct production costs, while Operating Expenses cover indirect costs like marketing, administration, and rent.
Can COGS Margin be negative?
Yes, if COGS exceeds revenue, the margin becomes negative, signaling unsustainable operations.
How does inflation affect COGS Margin?
Rising raw material and labor costs can increase COGS, leading to a higher margin unless offset by revenue growth or cost controls.
What tools can help track COGS Margin?
Financial software and accounting platforms allow real-time monitoring of revenue and cost metrics, aiding in margin analysis.
Can companies improve their COGS Margin?
Yes, through measures like negotiating supplier contracts, optimizing production processes, and adopting automation.


