


Cash per share (CPS) is a financial metric that indicates the amount of cash and cash equivalents a company holds relative to each outstanding share of its stock. It is a straightforward measure that focuses on a company’s most liquid assets. It can be viewed as an indicator of financial health, particularly in industries where liquidity is essential.
The metric provides investors with an understanding of a company’s liquidity position, highlighting how much cash is available for operations, debt repayments, dividends, or reinvestment.
The formula for calculating cash per share is simple:

Cash Per Share = Cash and Cash Equivalents / Number of Outstanding Shares
In this formula,
- Cash and Cash Equivalents refers to the liquid assets a company holds, including cash, bank accounts, marketable securities, and other short-term investments that can easily be converted into cash.
- Number of Outstanding Shares refers to the total number of shares that are currently owned by all shareholders, including institutional investors and company insiders.
This calculation gives a clear picture of how much cash is available per share.

Let’s consider a practical example:
- Cash and Cash Equivalents: $20 million
- Outstanding Shares: 8 million
Using the formula:
CPS = 20,000,000 / 8,000,000 = 2.5
This means that the company has $2.50 in cash per share. Investors may consider this a positive sign, especially if the company is facing uncertain market conditions or is preparing for a major investment opportunity.
Cash per share is a significant metric for both individual and institutional investors because it offers insight into a company’s liquidity and financial flexibility. Here are some key reasons why CPS is important:
Below, we explore the key reasons why CPS holds such significance.
- Liquidity Analysis: Cash per share highlights how much liquid cash is available to a company relative to its shares. Companies with higher CPS levels can cover short-term obligations and remain solvent even during economic downturns.
- Debt Management: High CPS could indicate that a company is in a good position to repay debt. If a company has a significant amount of cash on hand, it may be able to reduce its leverage by paying off debts, thus improving its financial stability.
- Investment Potential: Investors often look for companies with high CPS as it may signify a stronger ability to invest in growth opportunities. Having a large cash reserve allows companies to acquire assets, invest in research and development, or expand into new markets without relying on external funding.
- Dividend Payments: Companies with high CPS can distribute more consistent dividends, a key concern for income-focused investors. High levels of cash allow companies to maintain or increase dividend payouts even when business conditions are less favorable.
- Risk Mitigation: Cash per share can help mitigate business risks, such as during economic recessions or market volatility. A company with a robust cash position is better equipped to handle unexpected expenses or changes in market conditions.
Interpreting cash per share requires context. A higher CPS generally indicates that a company is in a stronger position to manage its operations, pay off liabilities, and invest in future growth.
While excessive cash could suggest that the company is not effectively using its resources to generate returns or invest in growth, a low or negative CPS might indicate that the company has limited cash reserves, potentially making it more vulnerable to economic downturns or unable to fund expansion initiatives.
However, it’s important to understand that having excess cash per share is not always a positive signal. Here’s how to interpret CPS in different scenarios:
- High CPS: A high cash per share indicates that a company is holding substantial liquid assets. While this can be a sign of financial strength, it could also imply that the company is not using its cash effectively. For instance, excessive cash may suggest the company is not reinvesting in growth opportunities or paying down debt.
- Low CPS: A low cash per share may suggest that the company has limited cash reserves, making it vulnerable in times of financial stress. However, this could also indicate that the company is actively reinvesting its cash into operations or growth opportunities, which may be positive depending on the company’s strategy.
- Fluctuating CPS: If the CPS fluctuates significantly over time, it might indicate that the company’s cash management practices are inconsistent, which could raise concerns about financial health. In this case, investors may need to investigate the reasons behind these fluctuations to understand whether they reflect sound business strategies.
What constitutes a “good” cash per share depends on the context and industry. Generally, a higher cash per share is better, but it should be evaluated alongside other financial metrics such as debt levels, return on investment (ROI), and overall profitability.
- For Mature Companies: Large, established companies may have a higher CPS as they accumulate cash over time. In this case, a higher CPS may indicate stability and the ability to weather economic downturns.
- For Growth Companies: Growth companies, especially those in capital-intensive industries like tech or biotech, may have lower CPS due to their need to reinvest cash into expansion. A lower CPS may not necessarily be negative if the company is investing in future growth opportunities.
While Cash Per Share (CPS) is a valuable financial metric, it does come with certain limitations that investors should be aware of when analyzing a company’s financial health. Understanding these limitations ensures that CPS is used in the right context and alongside other financial indicators for a more comprehensive analysis.
Does Not Account for Liabilities
CPS only considers the cash position of the company without factoring in outstanding liabilities. A company may have a high CPS but also high debt levels, which can limit the effectiveness of its cash reserves.
Excess Cash May Be Unused
Holding large amounts of cash may not always be a sign of strength. It could indicate that the company is not effectively utilizing its resources for growth or investment, leading to a potential underperformance in the long run.
Industry-Specific Differences
The ideal level of cash per share varies by industry. Some industries, such as technology or pharmaceuticals, may require more cash reserves due to the need for significant research and development investments, while others, such as retail or consumer goods, may have less need for cash reserves.
Cash Management Strategies
Companies may engage in aggressive cash management practices, such as delaying payments to suppliers or stretching out receivables, to improve their CPS. Such tactics could be unsustainable and distort the true financial health of the business.
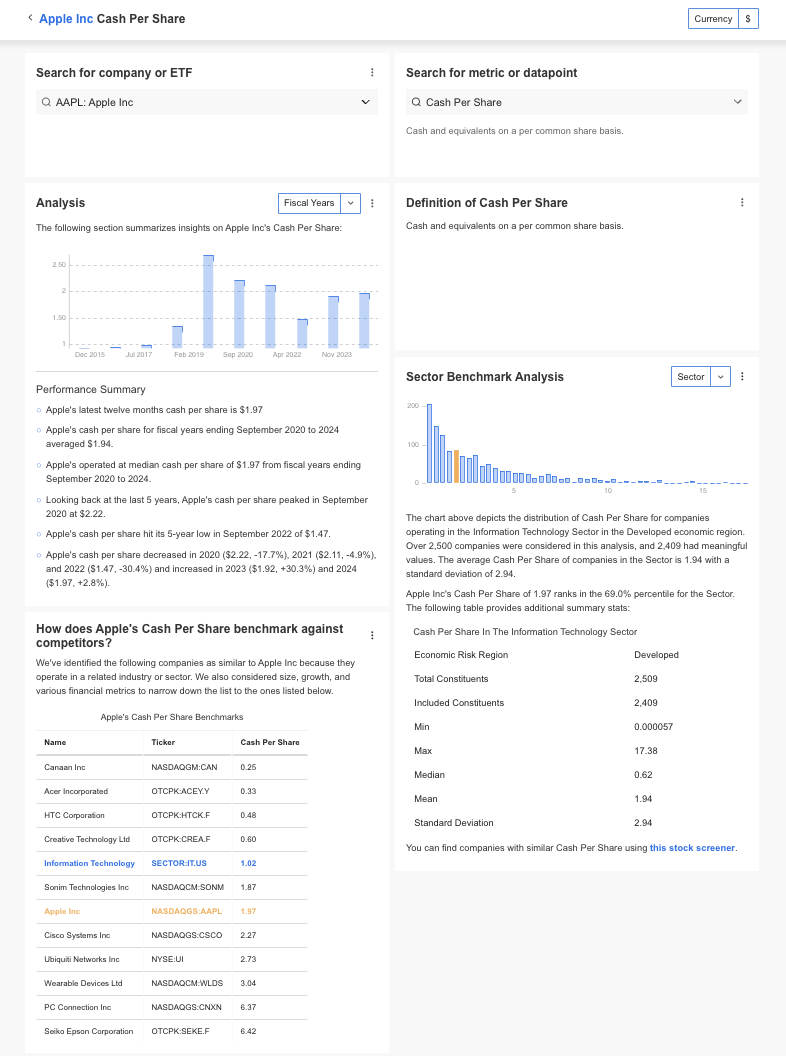
InvestingPro offers detailed insights into companies’ Cash Per Share (CPS) including sector benchmarks and competitor analysis.
Unlock Premium Data With InvestingPro 📈💸
Gain instant access to Cash Per Share data within the InvestingPro platform
🛠 Access to 1200+ additional fundamental metrics
🔍 Competitor comparison tools
📊 Evaluate stocks with 14+ proven financial models
Cash per share refers to the amount of cash a company holds, while cash flow per share measures the cash generated by a company’s operations divided by the number of shares. CPS focuses on liquidity, while cash flow per share measures operational cash generation.
Not necessarily. While a high CPS can indicate strong liquidity, it may also suggest that the company is hoarding cash instead of using it to invest in growth or pay down debt, which could be seen as inefficient.
Yes, CPS is a useful indicator for dividend investors. A high cash per share can suggest that a company has enough liquidity to sustain or increase its dividend payouts.
Cash per share reflects the actual liquidity of the company, while EPS shows profitability. A company with a high EPS but low CPS might be profitable on paper but lacks liquidity, which could be risky in times of financial stress.


