What is Beneish M-Score?
The Beneish M-Score is a financial metric designed to identify whether a company may be manipulating its earnings. Developed by Professor Messod Beneish, this score uses a mathematical model based on eight financial ratios. By analyzing these ratios, the Beneish M-Score helps investors and analysts detect potential cases of earnings management or fraudulent activity in a company’s financial statements.
The Beneish M-Score has gained widespread recognition for its role in uncovering fraud, including its application in identifying financial discrepancies in high-profile cases like Enron.
How to Calculate Beneish M-Score?
The formula for calculating the Beneish M-Score is:

M-Score = −4.84+(0.920×DSRI)+(0.528×GMI)+(0.404×AQI)+(0.892×SGI)+(0.115×DEPI)-(0.172×SGAI)+(4.679×TATA)-(0.327×LVGI)
Each variable in the formula represents specific financial ratios:
- DSRI (Days’ Sales in Receivables Index): Measures changes in accounts receivable relative to sales.
- GMI (Gross Margin Index): Tracks changes in gross profit margins.
- AQI (Asset Quality Index): Indicates shifts in the quality of a company’s assets.
- SGI (Sales Growth Index): Reflects year-over-year revenue growth.
- DEPI (Depreciation Index): Analyzes changes in depreciation policies.
- SGAI (Sales, General, and Administrative Expenses Index): Tracks trends in administrative expenses.
- LVGI (Leverage Index): Measures changes in financial leverage.
- TATA (Total Accruals to Total Assets): Evaluates the relationship between accruals and assets.
A calculated M-Score greater than -2.22 suggests a higher likelihood of earnings manipulation, while a score below this threshold implies less risk.

Detailed Example Calculation of Beneish M-Score
To illustrate the Beneish M-Score calculation, consider the following financial data for a hypothetical company:
| Variable | Formula/Value | Result |
| DSRI | Receivables/Sales (Year 2 ÷ Year 1) | 1.20 |
| GMI | (Gross Margin Year 1 ÷ Gross Margin Year 2) | 1.05 |
| AQI | Non-Current Assets Year 2 ÷ Total Assets Year 1 | 1.30 |
| SGI | Revenue Year 2 ÷ Revenue Year 1 | 1.25 |
| DEPI | Depreciation Year 1 ÷ Depreciation Year 2 | 0.95 |
| SGAI | SGA Expenses Year 2 ÷ SGA Expenses Year 1 | 1.10 |
| LVGI | Debt to Assets Year 2 ÷ Debt to Assets Year 1 | 1.50 |
| TATA | (Net Income – Operating Cash Flow) ÷ Total Assets | 0.04 |
Now substitute these values into the formula:
M-Score= −4.84 + (0.920×1.20) + (0.528×1.05) + (0.404×1.30) + (0.892×1.25) + (0.115×0.95) − (0.172×1.10) + (4.679×0.04) − (0.327×1.50)
Simplifying each term:
- 0.920 × 1.20 = 1.104
- 0.528 × 1.05 = 0.5544
- 0.404 × 1.30 = 0.5252
- 0.892 × 1.25 = 1.115
- 0.115 × 0.95 = 0.10925
- −0.172 × 1.1 = −0.1892
- 4.679 × 0.04 = 0.1871
- −0.327 × 1.50 = −0.4905
Add the results
M−Score = −4.84 + 1.104 + 0.5544 + 0.5252 + 1.115 + 0.10925 −0.1892 + 0.1871 − 0.4905
M-Score = -1.924
With a score of -1.924 (slightly greater than -2.22), this company exhibits a slight risk of earnings manipulation.
Why is Beneish M-Score Important?
The Beneish M-Score holds immense importance in financial analysis, corporate governance, and investment decision-making. Its value lies in its ability to identify potential earnings manipulation and fraudulent accounting practices, which can significantly impact stakeholders, including investors, regulators, and auditors.
Below are the key reasons why the Beneish M-Score is crucial:
Early Fraud Detection
The primary purpose of the Beneish M-Score is to act as an early warning system for detecting financial irregularities. By analyzing specific financial ratios, it flags companies that may be overstating earnings or misrepresenting financial health. Early detection allows investors and regulators to investigate further before significant financial losses or legal scandals occur.
Safeguards Investors
Investors rely on accurate financial statements to make informed decisions. Manipulated earnings can mislead them into believing a company is more profitable or financially stable than it actually is. The Beneish M-Score helps investors identify high-risk companies and avoid potential losses by steering clear of entities with questionable accounting practices.
Enhances Financial Due Diligence
In mergers, acquisitions, or partnerships, due diligence is critical. The Beneish M-Score provides a quantitative method to assess the financial integrity of a target company. It helps acquirers identify risks related to earnings manipulation and make better-informed strategic decisions.
Supports Auditors and Regulators
Auditors and regulators can use the Beneish M-Score as part of their toolkit to monitor corporate financial practices. It aids in selecting high-risk companies for closer scrutiny, optimizing resources and ensuring that regulatory compliance is maintained across industries.
Promotes Corporate Accountability
The possibility of being flagged by tools like the Beneish M-Score may deter companies from engaging in aggressive accounting practices. This promotes transparency and accountability in financial reporting, fostering trust among stakeholders.
How to Interpret Beneish M-Score?
Interpreting the Beneish M-Score is vital for understanding whether a company is at risk of earnings manipulation or fraudulent reporting. The score provides a quantitative measure, but its implications depend on the threshold values and the financial context of the company being analyzed.
- Below -2.22: Low likelihood of earnings manipulation.
- Above -2.22: Indicates a higher probability of financial misrepresentation.
Here’s how to interpret the Beneish M-Score effectively:
The Threshold Value
The key threshold for the Beneish M-Score is -2.22:
- M-Score ≤ -2.22: Indicates a low likelihood of earnings manipulation. Companies with scores below this threshold are generally considered financially transparent and less likely to have engaged in aggressive accounting practices.
- M-Score > -2.22: Suggests a higher probability of earnings manipulation. Companies exceeding this threshold may warrant further investigation to understand the nature of their financial practices.
Gradation of Risk
While -2.22 serves as a benchmark, the distance from this value can also provide insights:
- Far below -2.22: Strong indication of clean financial reporting and minimal manipulation risk.
- Close to -2.22 but below: Mild assurance of transparency; however, caution is advised as companies near the threshold might still employ minor earnings management techniques.
- Slightly above -2.22: Potential for manipulation exists; the closer the score is to zero, the higher the likelihood of financial misrepresentation.
- Significantly above -2.22: High probability of manipulation or fraud, suggesting immediate need for scrutiny.
What are the Limitations of Beneish M-Score?
While the Beneish M-Score is a valuable tool for detecting potential earnings manipulation, it is not without its limitations. Understanding these shortcomings is essential to avoid misinterpretation and over-reliance on the metric. Here are the key limitations of the Beneish M-Score:
Not Foolproof for Detecting Fraud
The Beneish M-Score is designed to identify the likelihood of earnings manipulation, but it cannot confirm fraud. Companies flagged with a high M-Score may still have legitimate reasons for their financial results, and further investigation is required to determine if manipulation is present.
High False Positive Rate
Not all companies with a high Beneish M-Score are engaging in fraudulent practices. Companies undergoing significant growth, mergers, or restructuring may naturally exhibit financial trends that resemble manipulation, leading to false positives.
Sensitive to Data Quality
The accuracy of the Beneish M-Score heavily depends on the quality and reliability of the financial data used. Inaccurate or incomplete financial statements can lead to misleading scores. Companies intentionally misreporting their numbers might skew the M-Score entirely.
Industry-Specific Variations
The model does not account for differences across industries. Certain sectors, such as technology or real estate, often experience higher volatility or atypical financial patterns, which could lead to false positives or negatives. Comparing M-Scores without considering industry norms can result in inaccurate conclusions.
Dependent on Historical Financial Data
The M-Score relies solely on historical financial statements, which may not always reflect current realities. Manipulation occurring outside the financial reporting period or through off-balance sheet items might go undetected.
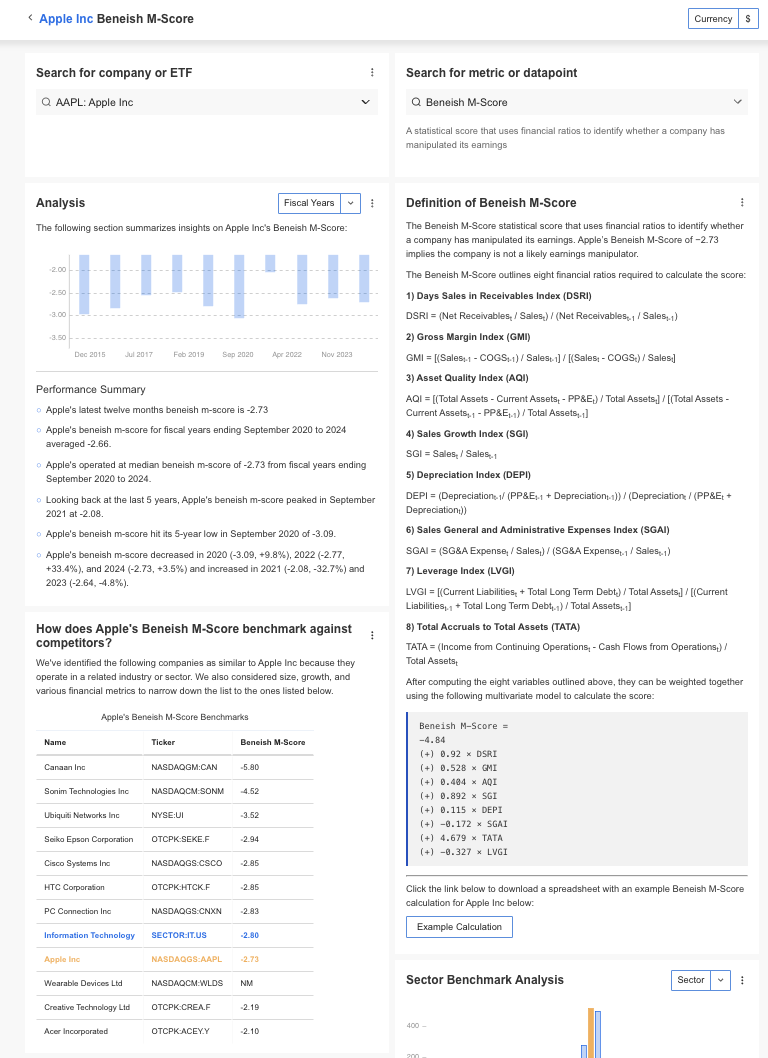
How to Find Beneish M-Score?
InvestingPro offers detailed insights into companies’ Beneish M-Score including sector benchmarks and competitor analysis.
InvestingPro+: Access Beneish M-Score Data Instantly
Unlock Premium Data With InvestingPro 📈💸
Gain instant access to Beneish M-Score data within the InvestingPro platform
🛠 Access to 1200+ additional fundamental metrics
🔍 Competitor comparison tools
📊 Evaluate stocks with 14+ proven financial models
Beneish M-Score FAQ
Can the Beneish M-Score predict fraud with certainty?
No, it highlights potential manipulation risks but cannot confirm fraud. Additional analysis, such as forensic audits or contextual reviews, is essential to determine whether irregularities indicate fraudulent practices.
Is the Beneish M-Score relevant for all industries?
It is most effective for publicly traded firms but may produce false positives in industries with unique financial dynamics, such as volatile cash flows or atypical expense patterns, which can mimic signs of manipulation.
How often should the M-Score be calculated?
Calculating the score quarterly or annually aligns with reporting cycles, allowing consistent monitoring of financial health and potential manipulation risks as new financial data becomes available.
Are there alternatives to the Beneish M-Score?
Yes, tools like the Altman Z-Score (financial distress) or Piotroski F-Score (financial strength) complement the M-Score by providing broader insights into a company’s overall financial stability.