Trend Model signal summary
Trend Model signal: Neutral
Trading model: Positive
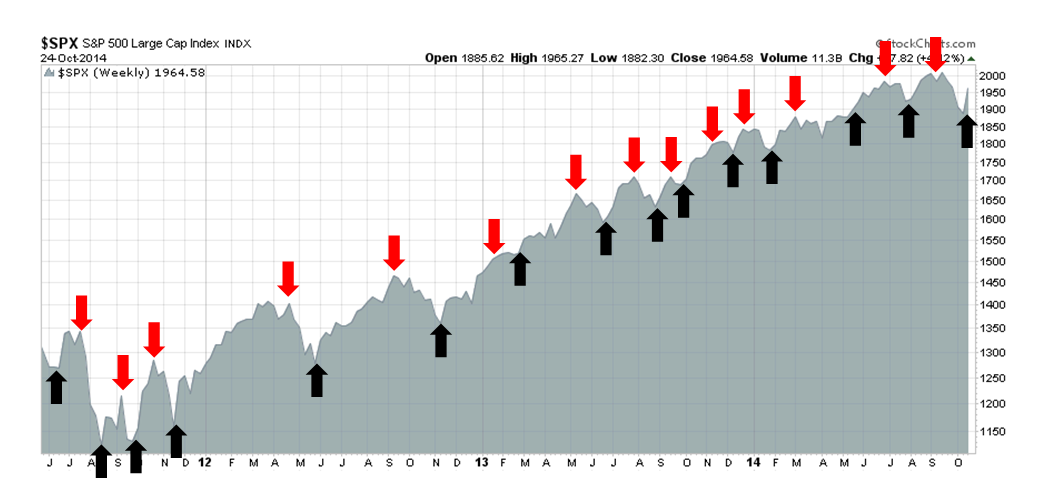
The Trend Model is an asset allocation model used by my inner investor. The trading component of the Trend Model keys on changes in direction in the Trend Model - and it is used by my inner trader. The actual historical (not back-tested) buy and sell signals of the trading component of the Trend Model are shown in the chart below:
Signs of global healing
Last week, our pet greyhound was bitten by another dog while playing at the park. Greyhound skin is extremely thin and fragile and he was badly wounded and traumatized. Several thousands in vet bills later, he is not totally out of the woods yet but he is starting to show signs of recovery.
Our dog incident is an apt metaphor for what has happened to the markets in the past couple of months. The markets were traumatized by fast-money re-positioning which sparked a rush for the risk-on exit (see my previous comments Correction, what correction?). Even though downside risks are ever present, I am seeing signs of global healing from that trauma.
The ECB closes ranks
Let's start with Europe, where Mr. Market's greatest short-term vulnerability rests, as he warns of possible weakness. This chart below, of the Euro STOXX 50 is rolling over, with the 50 and 200 days moving average acting as overhead resistance.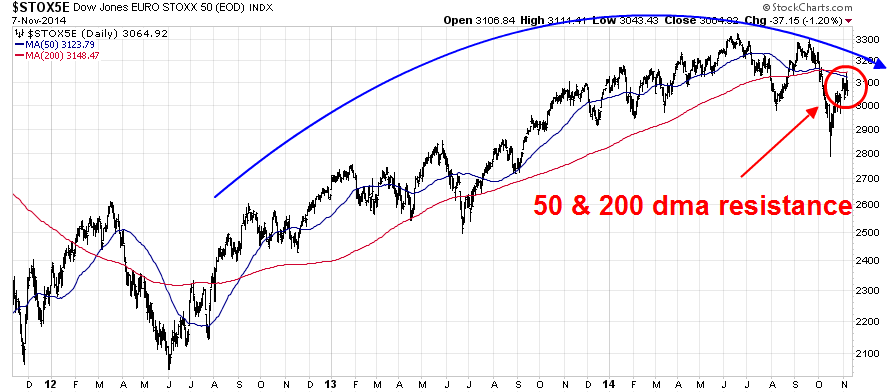
In response, we are starting to see signs of a policy reaction. ECB President Mario Draghi was talking dovishly last week as the ECB closed ranks to show a united front (via Reuters, emphasis added):
European Central Bank members all stand ready to take more policy action if needed to revive a struggling euro economy and the bank's staff will prepare the groundwork, President Mario Draghi said on Thursday.
The Italian doused concerns about his leadership style, saying the whole policymaking Governing Council had signed up to a statement which confirmed previous comments he had made on the amount of money the bank aimed to pump into the economy.
Whatever it takes, right? The elements of a compromise are falling into place and Europe is well on its way to implementing some form of the Mario Draghi Grand Plan 2.0. Such a development must be regarded bullishly for Europe's outlook.
Stabilization in China
As President Obama heads for the APEC meeting in Beijing next week, no doubt the markets will focus more on Asia and, in particular, China. Despite widespread reports of flagging growth in China, I am seeking signs of stabilization in the Chinese economy. Economic statistics from China are notoriously *cough* unreliable and *cough* manipulated *cough*.
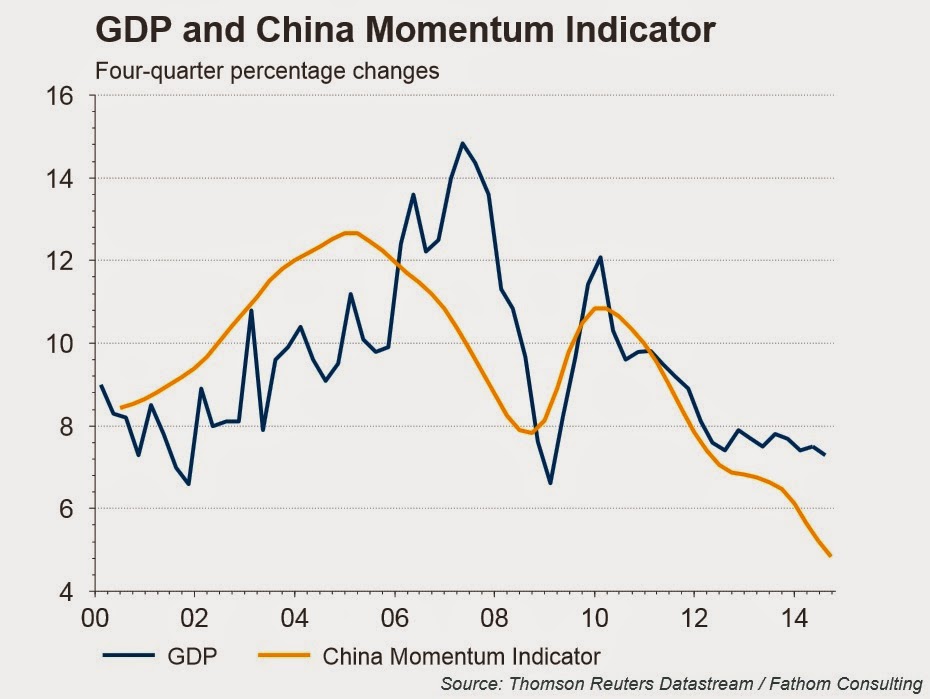
As a substitute to official figures, I rely on real-time market signals as a barometer of Chinese economic health. As an example, one of the key indicators I watch is the AUD/CAD currency rate. Both Australia and Canada are commodity producers, but Australia is more sensitive to the Chinese economy while Canada is more levered to the US. As the chart below shows, the AUD/CAD rate has stopped declining and appears to be testing the lower support level of a narrow range.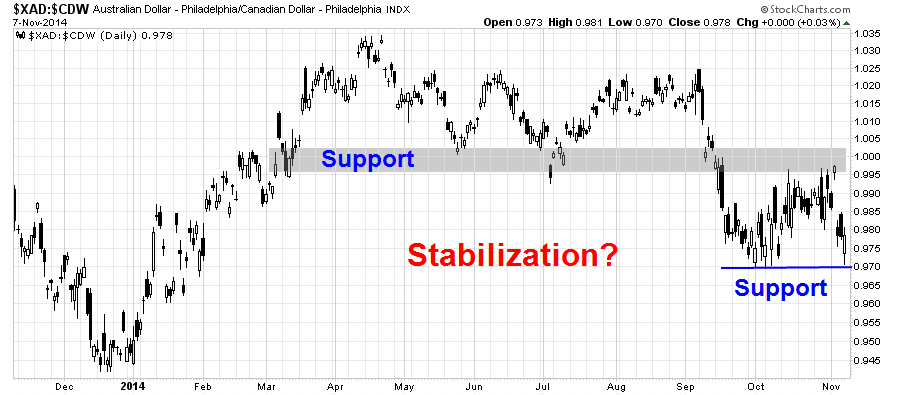
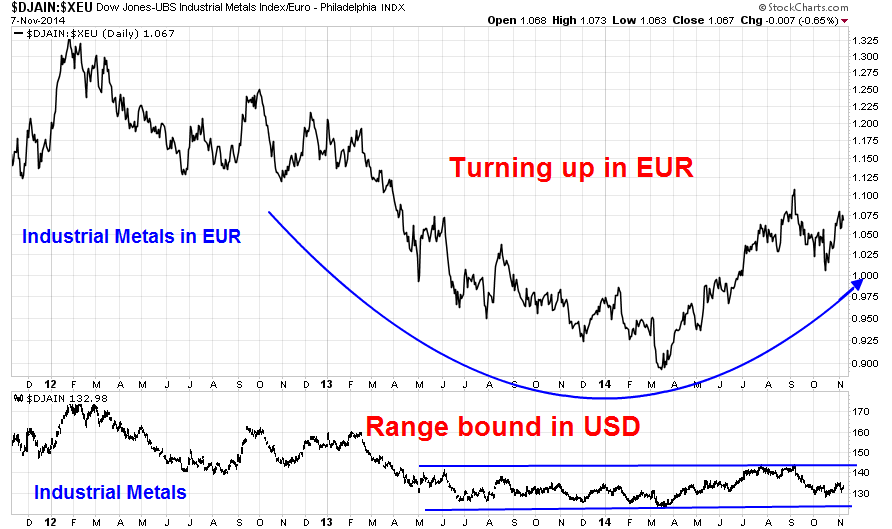
I normally watch commodity prices as an indicator of Chinese growth, but the USD strength has created significant headwinds for the commodity complex and therefore commodity indices like the CRB Index, which is priced in USD, may not be indicative of true Chinese demand. The chart below shows the price of the cyclically sensitive industrial metals, priced in EUR and USD. While industrial metals in USD (bottom panel) remain range bound, the same index in EUR appears to be making a saucer shaped bottom, indicating improving fundamental demand.
In addition, the PBoC stated last week that it will continue with its program of targeted liquidity injections into the banking system as the downside risks to the Chinese economy have risen (via SCMP):
The People's Bank of China has warned that downside risks in the mainland economy may intensify, while adding that it would use flexible tools to maintain proper liquidity and credit growth.
It also confirmed, for the first time, media reports on its use of a new instrument called a medium-term lending facility for liquidity injection - worth 769.5 billion yuan (HK$976 billion) in the past two months - to lower borrowing costs.
"The downward pressures and potential exposure to risks in the economy may increase somewhat over a certain period of time during the course of economic restructuring," the central bank said in its third-quarter monetary policy report issued yesterday.
It said it would "promote steady economic growth, while also preventing excessive 'liquidity ushering' from exacerbating a distorted economic structure, pushing up inflation and debt levels".
It pledged to fine-tune its policies based on changes in economic fundamentals, flexibly make use of multiple tools to adjust liquidity, and promote "reasonable growth" in credit and social financing.
Despite Beijing's pledge of "targeted stimulus", the leadership seems to have blinked in the face of slowing growth and given in to more of the same-old-same-old infrastructure project spending (via Reuters):
China approved more than $100 billion worth of infrastructure projects in late October and early November, state media said on Saturday, in a bid to bolster slowing growth in the world's second largest economy.
China's top economic planning body, the National Development and Reform Commission (NDRC), approved 21 infrastructure investment projects between Oct. 16 and Nov. 5 with a total investment value of 693.3 billion yuan ($113.24 billion), the official Xinhua news agency said on Saturday, citing state radio.
The projects included 16 railways and five airports, with the aim of propping up a decline in real estate investment, Xinhua said.
Such a policy about-face does little to further the stated policy of re-balancing growth away from credit-driven infrastructure growth to consumer growth, the short-term effect is to put a floor on further growth rate erosion, which should be cheered by the markets.
Another possible bullish development out of Asia ahead of the APEC meeting is the news that China and Japan have started a dialogue about the disputed Senkakus (Diaoyu in Chinese) Islands in the South China Sea (via the NY Times):
Signaling a potential thaw in their long-frozen relations, China and Japan announced Friday that they would talk to each other about their competing positions on islands in the East China Sea and would gradually resume diplomatic and security discussions.
With that step, the leaders of both countries gave the first public declaration that they are trying to roll back a prolonged standoff that has inflamed nationalist sentiments, damaged economic ties and at times appeared to bring them close to military conflict.
Financial healing in America
In the US, I am seeing signs of financial healing as well. In the past few weeks, I have been writing about how forward EPS estimates have been falling and such episodes have historically been associated with stock market weakness. The latest Earnings Season analysis from John Butters of Factset shows that the decline in forward EPS estimates have been arrested.
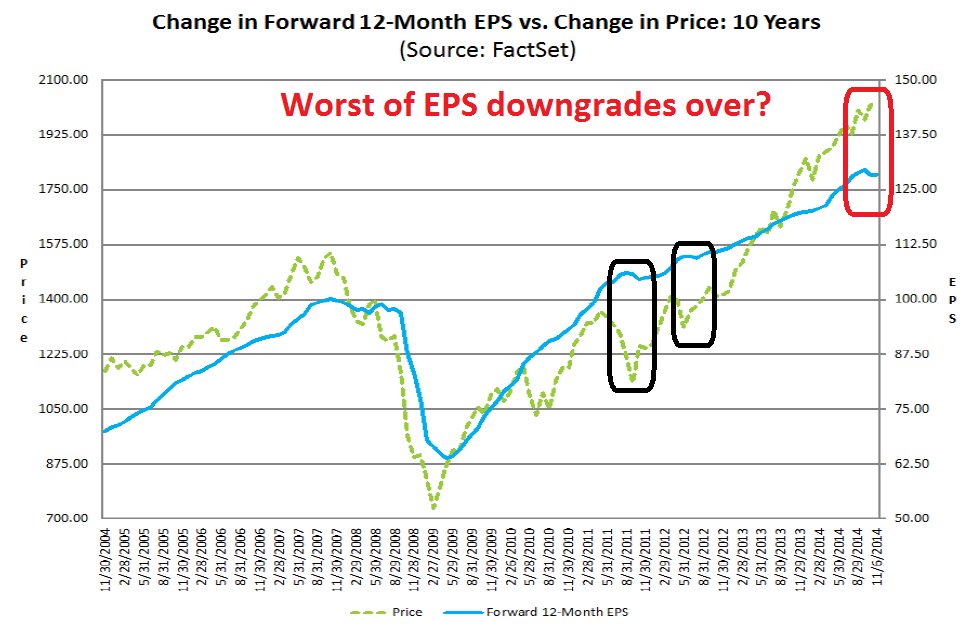
Another bullish sign for the US equity markets comes from Sam Eisenstadt, former research director at Value Line. Eisenstadt does not seem fazed by the recent spate of earnings downgrads. Mark Hulbert report that he remains bullish on the equity market:
This incredible bull market, which has earned the right to go sideways for a while, is instead going to keep powering ahead.
That, at least, is the forecast of the market timer who has more successfully called stocks’ direction in recent years than anyone I can think of. His latest forecast: The S&P 500 will rise to 2,225 in six months, 10.3% higher than where it stands today.
Hulbert reminded us of Eisenstadt`s last market forecast:
Six months ago, that model was forecasting that the SP 500 by the end of October would reach the 2,100 level, which at that time represented an 11.5% increase. As fate would have it, the SP 500’s actual six-month gain through the end of October was “only” 7.1%.
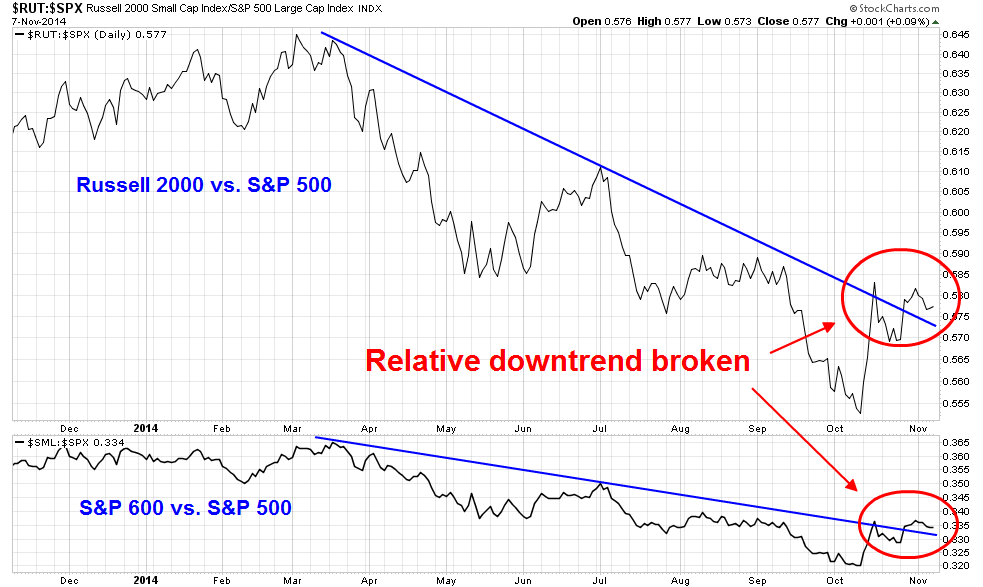
In addition, signs of healing are appearing in the batter small cap sector. The chart below shows the relative returns of the small cap Russell 2000 Index against the SPX (top panel) and the small cap S&P 600 against the SPX (bottom panel). In both cases, small cap stocks have rallied up through their respective relative downtrend lines, indicating stabilization and healing of risk appetite.
Limited downside
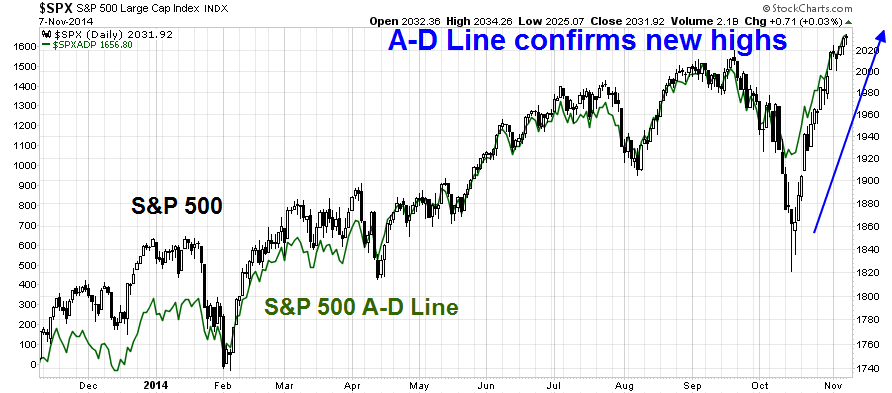
For now, I see limited downside for US equities. Breadth indicators such as the A-D Line are confirming the new highs set by the major large cap averages.
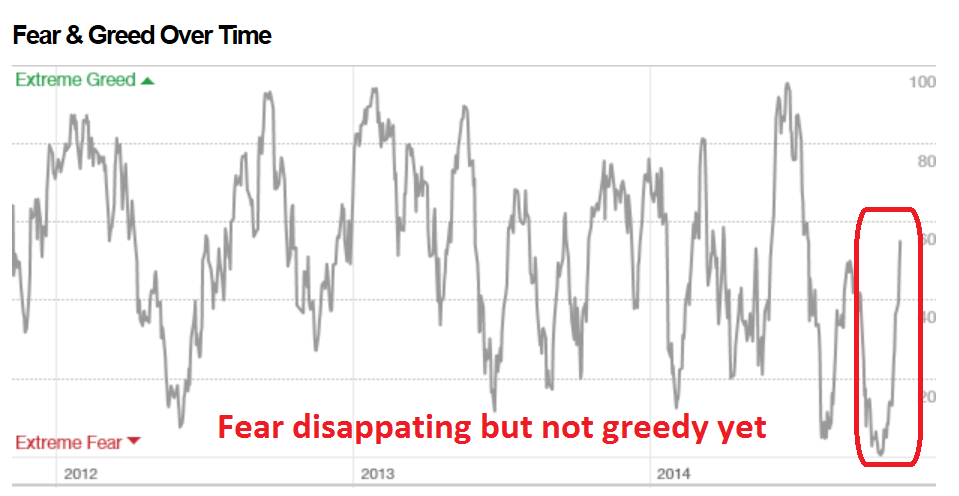
Given the V-shaped bottom that we just experienced, the only question is whether the market continues to grind upwards or pauses at current levels to digest its gains with a period of sideways consolidation. Despite its flows, the CNN Money Fear and Greed Index has moved from fear to neutral, but it is not at a greed reading yet.
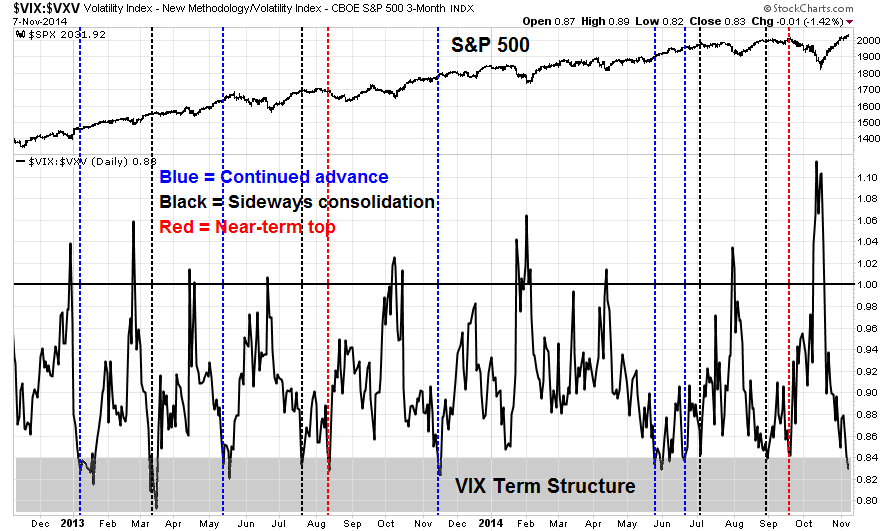
The chart below of the term structure of the VIX Index shows that the term structure has moved to levels that could be indicate investor exuberance. Similar episodes in the last couple of years have either resolved themselves with further upside (blue dotted line), sideways consolidation (black) or pullbacks (red). A glance at the chart shows a lot of blue and black lines with very few red lines. This reading suggests that downside risk is relatively low.
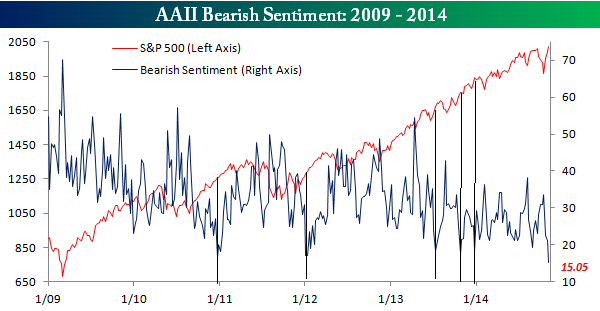
Before you starting writing me about how the latest AAII Sentiment Survey shows a crowded long as bullish sentiment has spike and bearish sentiment has dropped. I would discount sentiment surveys because they ask what people think, not how they are acting. I prefer indicators such as those based on option positioning like the VIX term structure showing what market participants are actually doing with their money.
Sentiment surveys are notoriously unreliable, as illustrated by the annotated chart from Bespoke of AAII bears, which shows that past low extremes in bearish sentiment (shown by vertical lines) have generally not marked short-term tops.
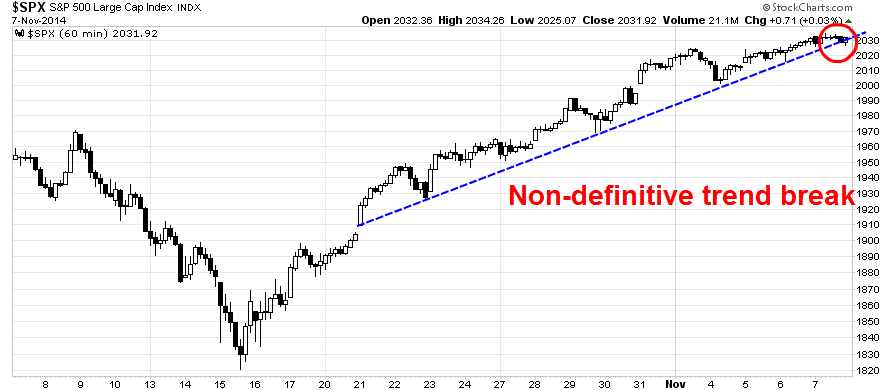
Tactically speaking, the hourly SPX chart showed a minor violation of an uptrend line at the close Friday, indicating the consolidation scenario is very much in play. However, that will have to be confirmed by the market action on Monday.
Stay with the leaders
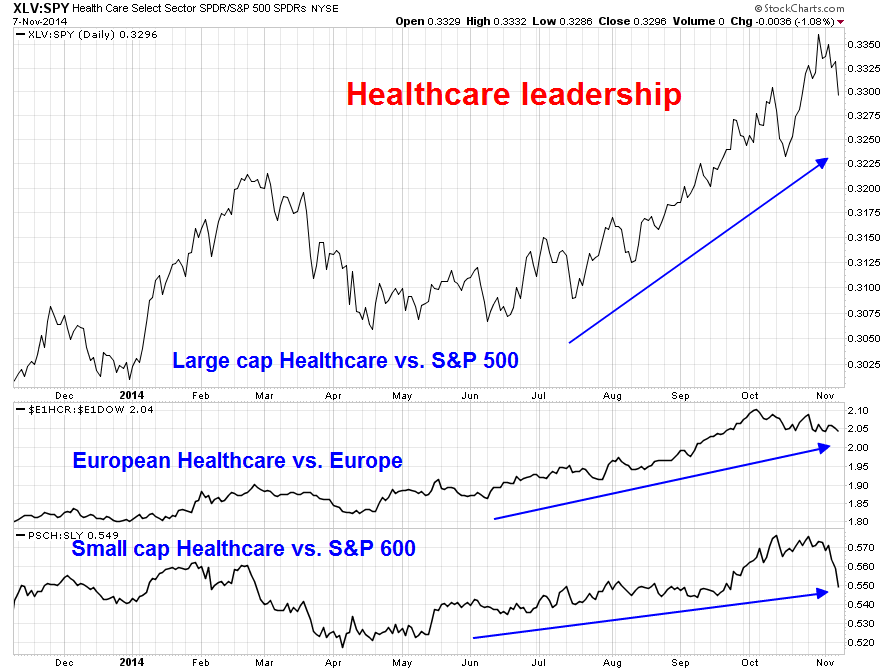
Under the circumstances, my inner investor is cautiously bullish and he is inclined to tilt his portfolio with an overweight position in the market leaders. As the theme of this post has been healing, the consistent market leadership in the current bull phase has been the Healthcare sector (see my previous post The one sector every US equity investor needs to look at). The chart below shows the relative performance of the US large cap (via SPDR S&P 500 (ARCA:SPY)), European and US small cap healthcare stocks (via SPDR - Health Care (ARCA:XLV) among others). The leadership shown by this sector has been broad and global.
My inner trader agrees with Brett Steenberger`s assessment of current market conditions:
Recent looks at breadth and sentiment and the strength of the market rally suggested that the current move higher in the U.S. stock market was unlike recent ones, with significant upside momentum. So far, that has proven to be the case.
Steenberger went on to outline the analytical framework and explained that he believes that we are in the mature phase of the bull phase, but the downside appears to be limited at this point because significant selling pressure has yet to appear:
Market cycles typically begin with a liftoff from lows on very strong breadth and momentum. As the upward phase of the cycle matures, we begin to see increasing differentiation among stock sectors, with the strongest continuing higher and the weaker ones diverging. During this maturation, volumes tend to drop and, with them both volatility and correlation. During the more mature phases of a cycle, the intensity of buying pressure wanes, but selling pressure also remains low. It is when selling pressure picks up that we begin an actual down phase to the cycle.
My inner trader remains cautiously bullish, but he is holding some cash reserves ready and he gets the opportunity to buy on a dip.
Disclosure: Long CURE, TNA
Cam Hui is a portfolio manager at Qwest Investment Fund Management Ltd. ("Qwest"). This article is prepared by Mr. Hui as an outside business activity. As such, Qwest does not review or approve materials presented herein. The opinions and any recommendations expressed in this blog are those of the author and do not reflect the opinions or recommendations of Qwest.
None of the information or opinions expressed in this blog constitutes a solicitation for the purchase or sale of any security or other instrument. Nothing in this article constitutes investment advice and any recommendations that may be contained herein have not been based upon a consideration of the investment objectives, financial situation or particular needs of any specific recipient. Any purchase or sale activity in any securities or other instrument should be based upon your own analysis and conclusions. Past performance is not indicative of future results. Either Qwest or Mr. Hui may hold or control long or short positions in the securities or instruments mentioned.
