Whether US equities are in a bear market or not is debatable. Regardless, I think there’s now a 60% chance that Janet Yellen will hike rates on September 17.
If global stock markets stabilize and rally over the next week or so, Janet will be even more likely to take action.
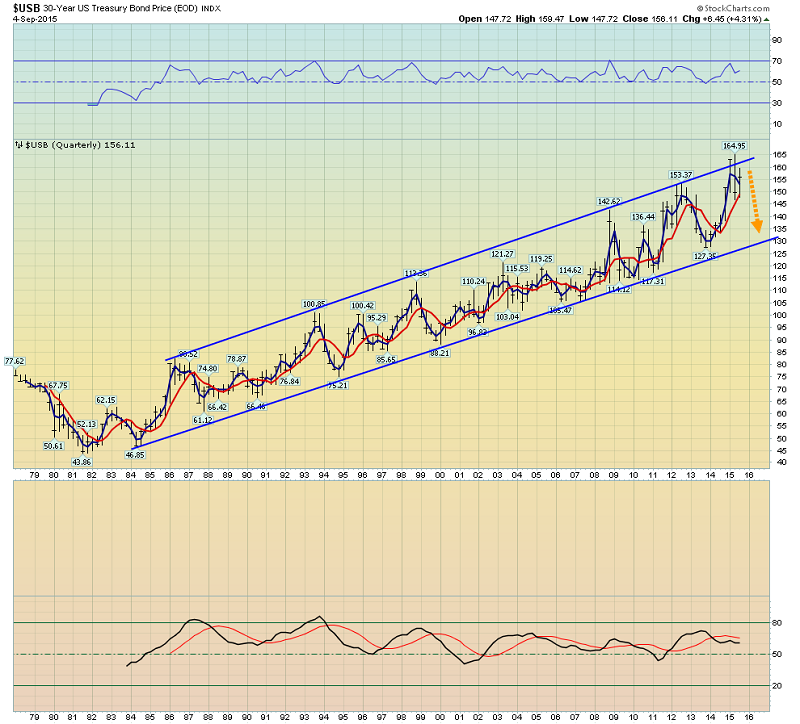
That’s the quarterly bars T-bond chart. T-bonds have almost quadrupled, since bottoming in 1981 in the 44 area.
They are trading in the upper part of the trend line channel now, and technically “due” to decline to the lower demand line.
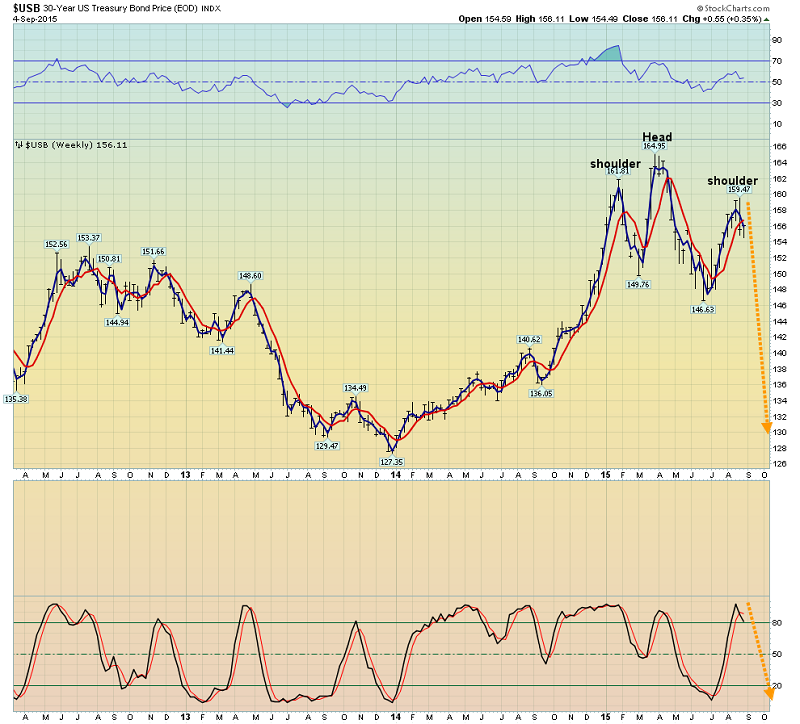
That’s the weekly T-bond bars chart. It looks horrible. Clearly, the technical situation of the T-bond market suggests rate hikes are imminent.
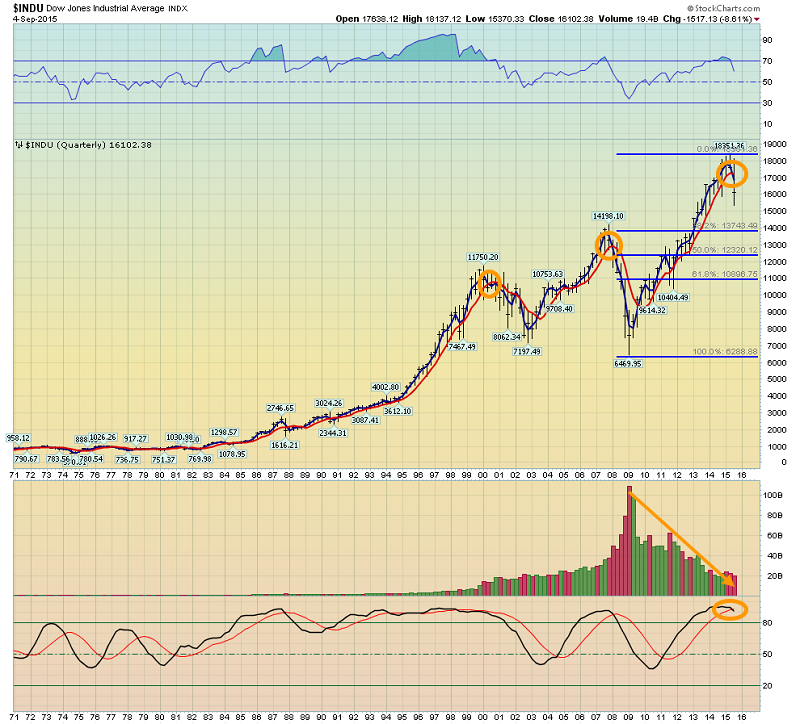
A rate hike could also harm the US stock market. That’s a quarterly bars chart of the Dow and it looks ominous. Since the 2009 lows, the Dow almost tripled, but volume has steadily declined.
Since it lost upside momentum in late 2014, volume has begun to rise again. From a technical standpoint, this is a very dangerous situation. It’s possible that a September rate hike could be the catalyst for a 1929-style crash in the US stock market.
I bought the Dow in 2008 and early 2009, and sold about 18 months later, for roughly a 100% overall gain. I’m not greedy, and I would not re-enter the US stock market unless the Dow declines to the 14,200 area.
If Janet hikes rates and the market begins crashing, investors who bought near the 2014 highs would probably panic, and that could create a crash in both stocks and bonds. In that situation, gold and fiat cash would likely be viewed as safe havens.
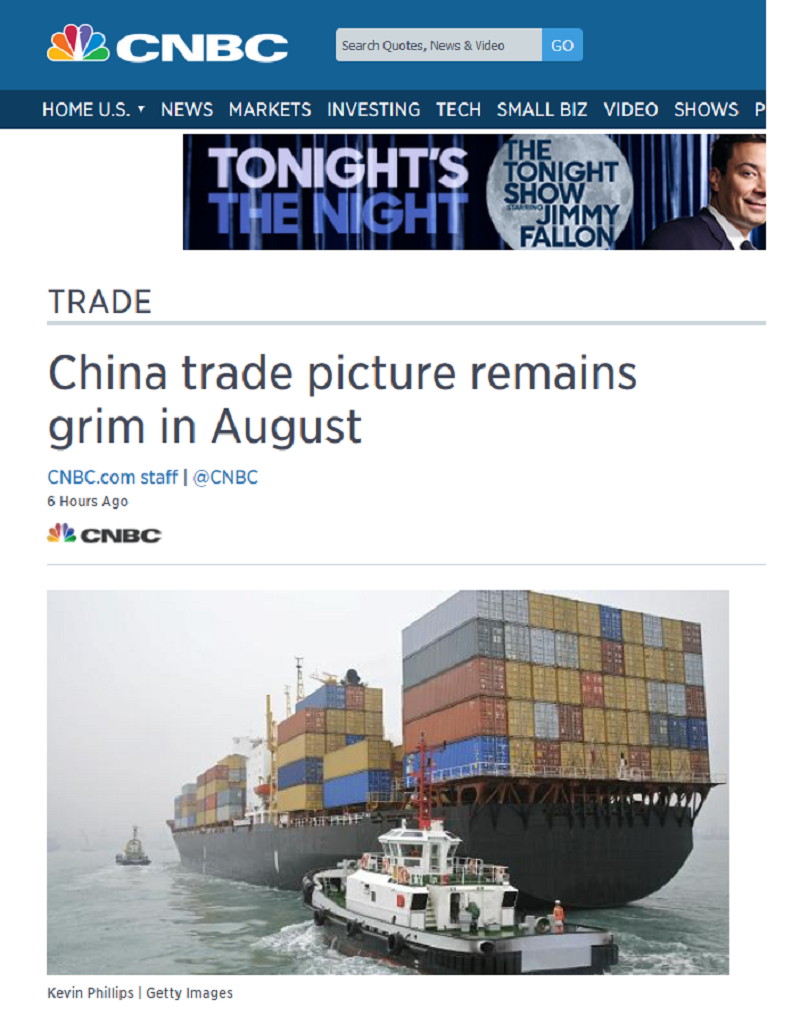
Chinese exports declined in August, according to CNBC news.
I would ask the Western gold community to remember that China’s official government policy is to transition the economy away from exports, and towards domestic consumption.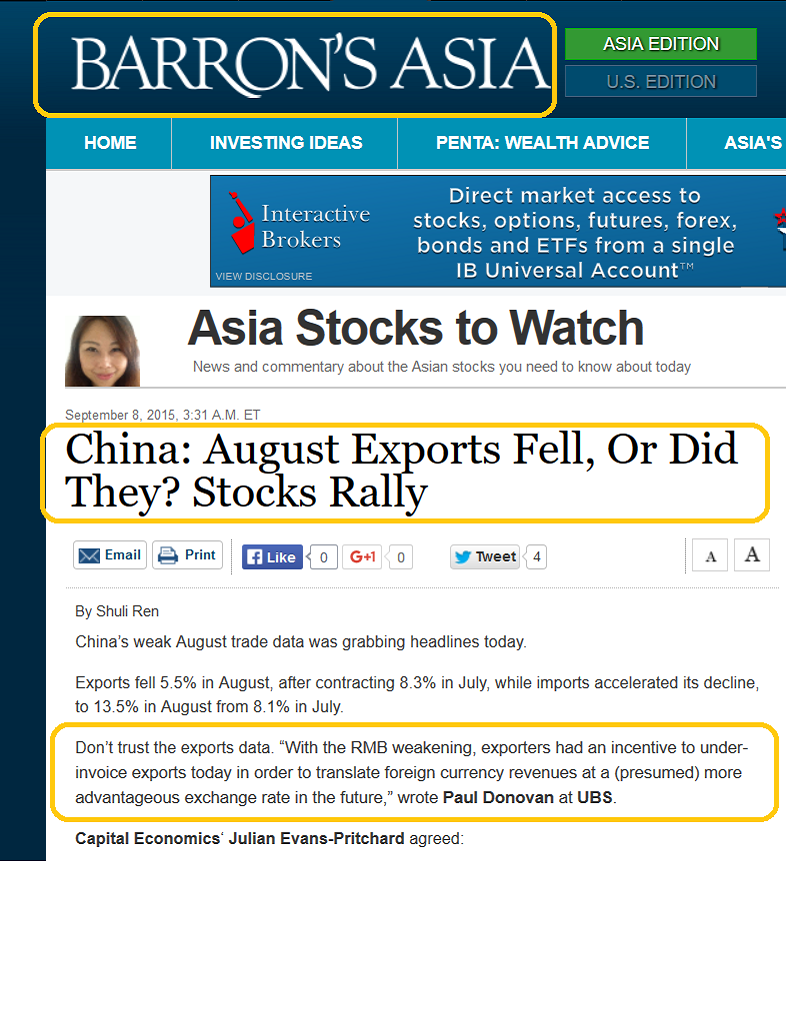
On that note, domestic car sales at leading companies in China rose in August. Barron’s writer Shuli Ren quotes several top economists who believe Chinese exporters may be under-invoicing their customers in the short term. That makes the export numbers look weaker than they really are.
While I wouldn’t touch the US stock market unless the Dow declines to 14,200, I’m very comfortable buying the stock market indexes of China and India at the current time, and I’m doing so.
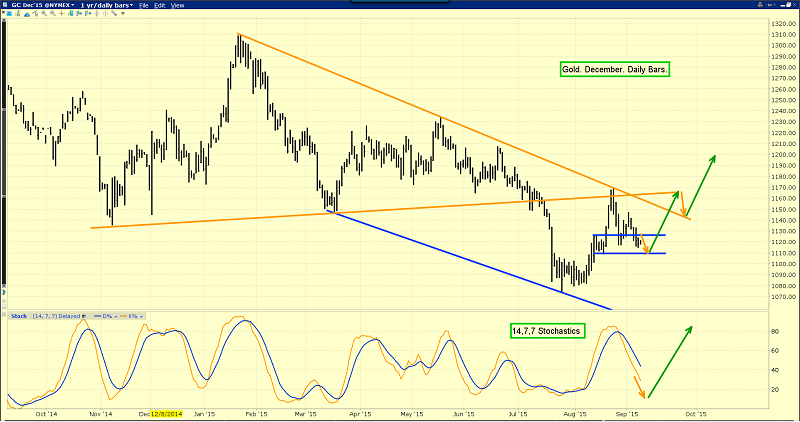
That’s the daily gold chart. A week ago, I suggested gold could decline to about $1110, and do so as the US jobs report was released.
It went to about $1115. Note the position of my 14,7,7 series Stochastics oscillator now, at the bottom of the chart. There’s still room for gold to decline, but only slightly, before a bigger rally unfolds.
Gold often declines in the days ahead of the US jobs report, and then rallies significantly in the days/weeks following the release of that report. This time, the situation is more complex, because of the key September 17 FOMC meeting.
That meeting could mark the end of the bond bull market that began in 1981, about 34 years ago! For gold price discovery in the immediate term, the jobs report is simply not as important as the FOMC meeting.
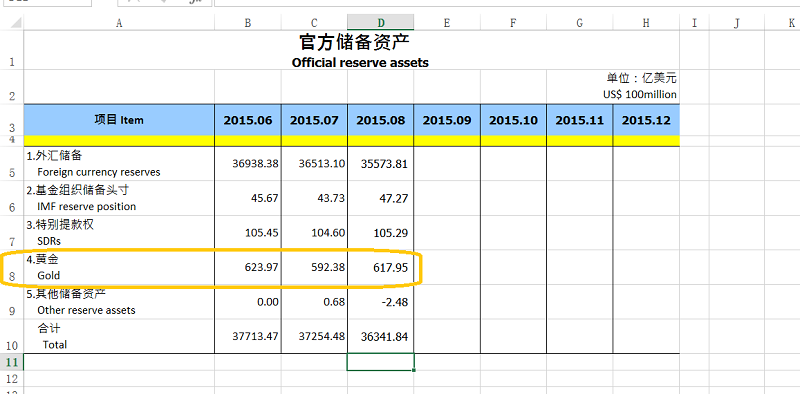
Gold feels quite solid ahead of that meeting. Yesterday, China’s State Administration of Foreign Exchange (SAFE) released their statistics for the month of August.
Interestingly, foreign currency reserves declined, yet gold reserves, IMF reserves and SDR reserves were all increased modestly. BullionVault reports that China added about 16 tonnes of gold to its reserves.
I predicted that China’s central bank would begin a modest and transparent buy program in 2015, and now it is here. I realize that some gold price enthusiasts had hoped that China was secretly accumulating thousands of tonnes of gold. They hoped there would be a dramatic event or announcement that would create a parabola move to the upside for the price.
The reality of Chinese buying is probably much more mundane, but it’s still great news for gold investors. There is a buy program in place now. The monthly purchases appear to be in the 15 – 30 tons range. That is very supportive for gold,especially given the apparent peak in mine supply that is occurring this year.
As more sizable Chindian players commit to long term gold buy programs (I think India’s central bank will also do it soon), Western gold community investors should feel very comfortable buying modest amounts of gold and related items on any price sale.
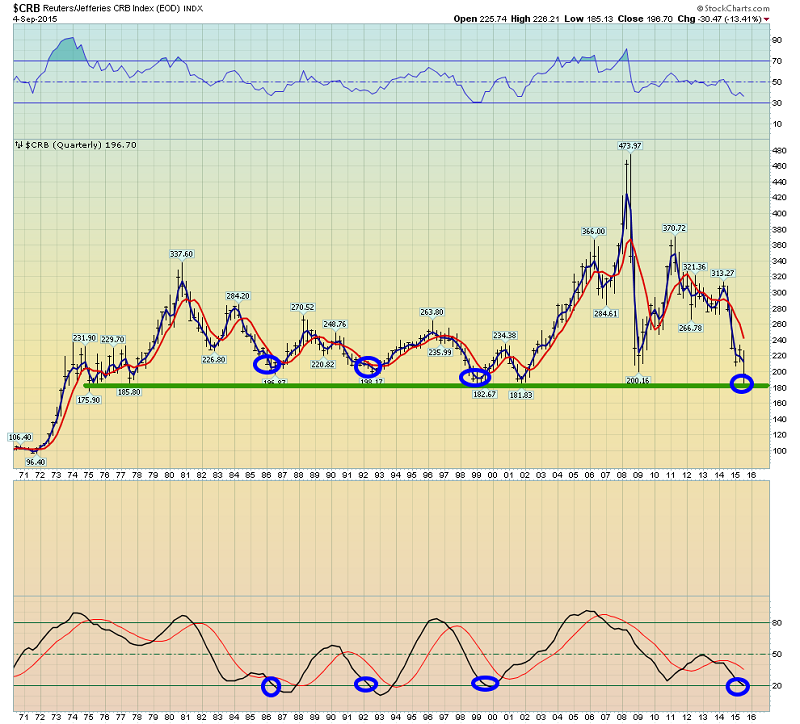
That’s the CRB Index quarterly bars chart. I like to use the 14,10,10 series Stochastics oscillator on most of my quarterly charts. It’s reached the oversold area, and enormous rallies have consistently begun from there. The index itself is near massive buy-side HSR (horizontal support & resistance). That extends back to about 1975! Institutional investors with a value orientation are likely buyers of commodity funds now, and that’s also supportive for gold.
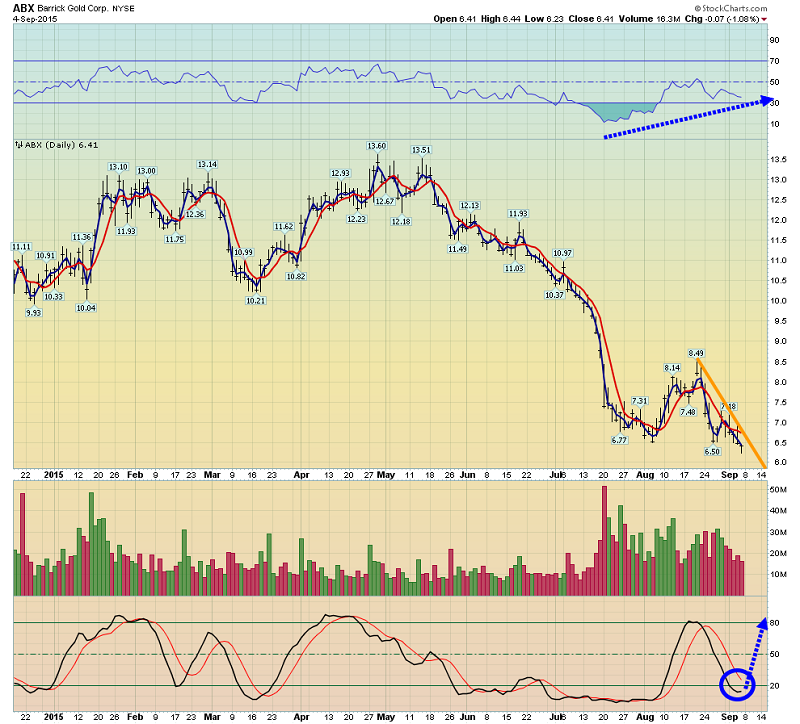
That’s the daily chart for Barrick Gold (NYSE:ABX). It could be argued that the recent price breakdown means gold will also trade at a new low, but note the very bullish positive divergence been shown by the RSI indicator at the top of the chart. The 14,7,7 Stochastics series also looks ready to turn higher. Gold has a remarkable history of rallying after the Fed hikes rates. I think the next rate hike could be the catalyst for a major gold stock rally, and it’s likely to start on September 17!
Thanks!
Cheers
Written between 4am-7am. 5-6 issues per week. Emailed at aprox 9am daily.
Stewart Thomson is a retired Merrill Lynch broker. Stewart writes the Graceland Updates daily between 4am-7am. They are sent out around 8am-9am. The newsletter is attractively priced and the format is a unique numbered point form. Giving clarity of each point and saving valuable reading time.
Risks, Disclaimers, Legal
Stewart Thomson is no longer an investment advisor. The information provided by Stewart and Graceland Updates is for general information purposes only. Before taking any action on any investment, it is imperative that you consult with multiple properly licensed, experienced and qualified investment advisors and get numerous opinions before taking any action. Your minimum risk on any investment in the world is: 100% loss of all your money. You may be taking or preparing to take leveraged positions in investments and not know it, exposing yourself to unlimited risks. This is highly concerning if you are an investor in any derivatives products. There is an approx $700 trillion OTC Derivatives Iceberg with a tiny portion written off officially. The bottom line:
Are You Prepared?
