Indian stock market prepared for a run to its long-term target of 10,000
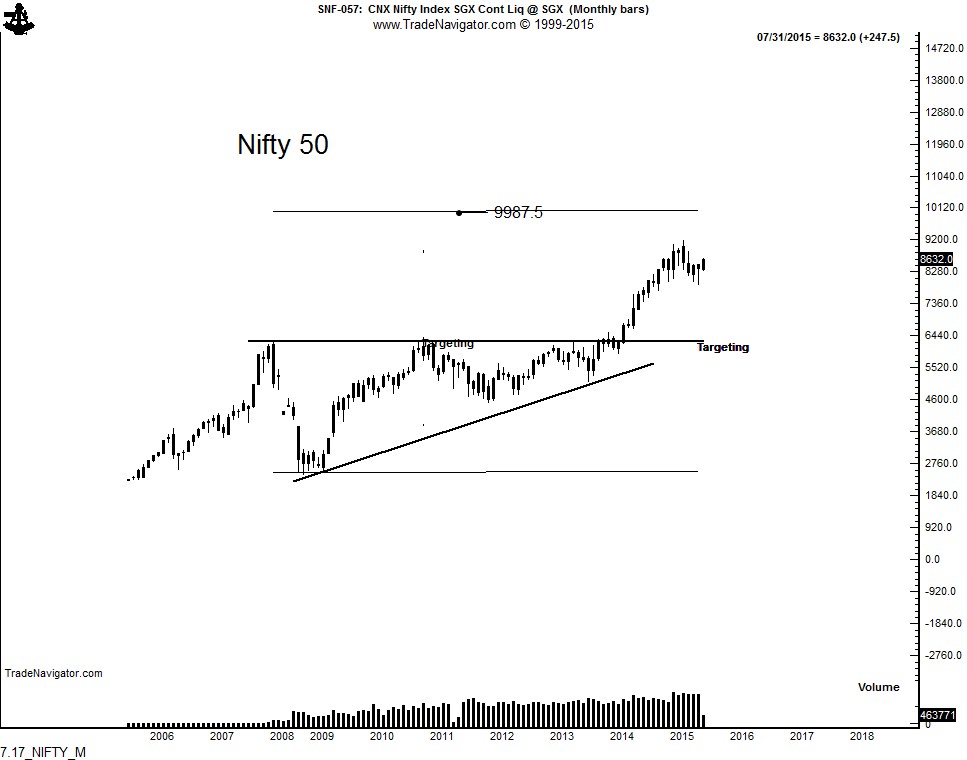
The Nifty's advance in March 2014 completed a 6-year ascending triangle on the monthly graph and established a target in the Nifty of 10,000, as shown below.
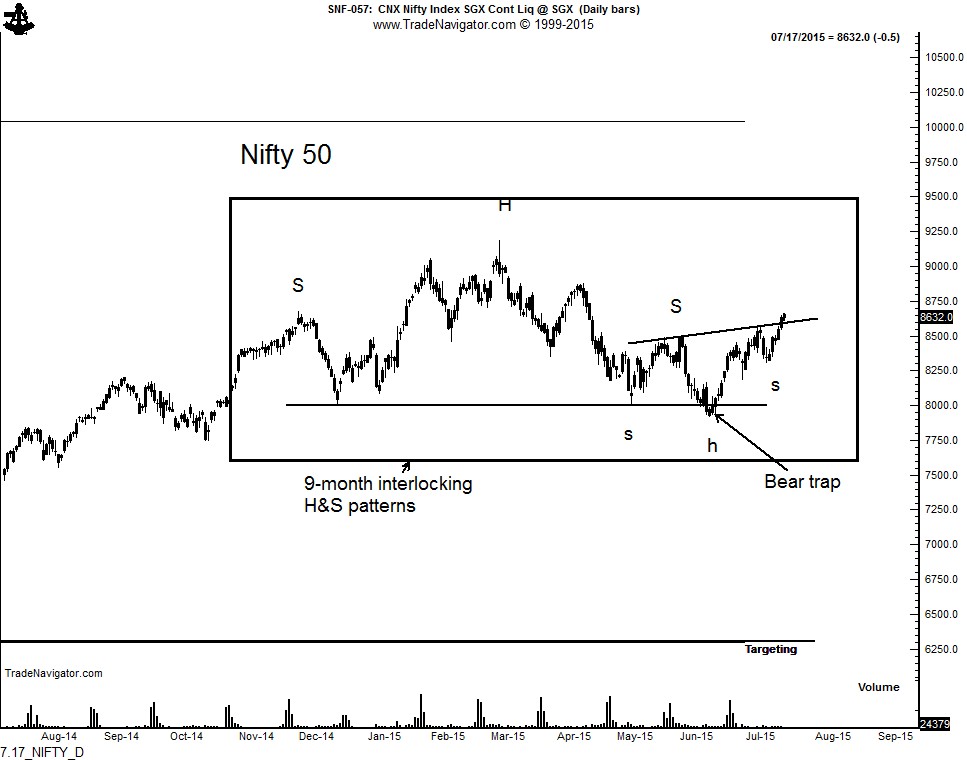
The daily graph has developed an extremely rare chart construction — an interlocking H&S. Several observations are worthy of note on this chart:
First, notice the completion in mid June of a clearly defined H&S top pattern. Factor commented at the time that this breakout was more likely to become a bear trap whereby weak longs were washed out of their positions. This is exactly what happened.
Second, the daily graph has formed an inverted 3-month H&S pattern with an up-slanted neckline. The left shoulder of this smaller H&S served as the right shoulder of the larger H&S top pattern — thus, an interlocking H&S.
If the above analysis is correct, the July 9 low at 8310 should hold. The market appears to be back on track toward its long-term target.
Which stock should you buy in your very next trade?
AI computing powers are changing the stock market. Investing.com's ProPicks AI includes 6 winning stock portfolios chosen by our advanced AI. In 2024 alone, ProPicks AI identified 2 stocks that surged over 150%, 4 additional stocks that leaped over 30%, and 3 more that climbed over 25%. Which stock will be the next to soar?
Unlock ProPicks AI


