Investing.com’s stocks of the week
SPDR S&P 500 (NYSE:SPY)
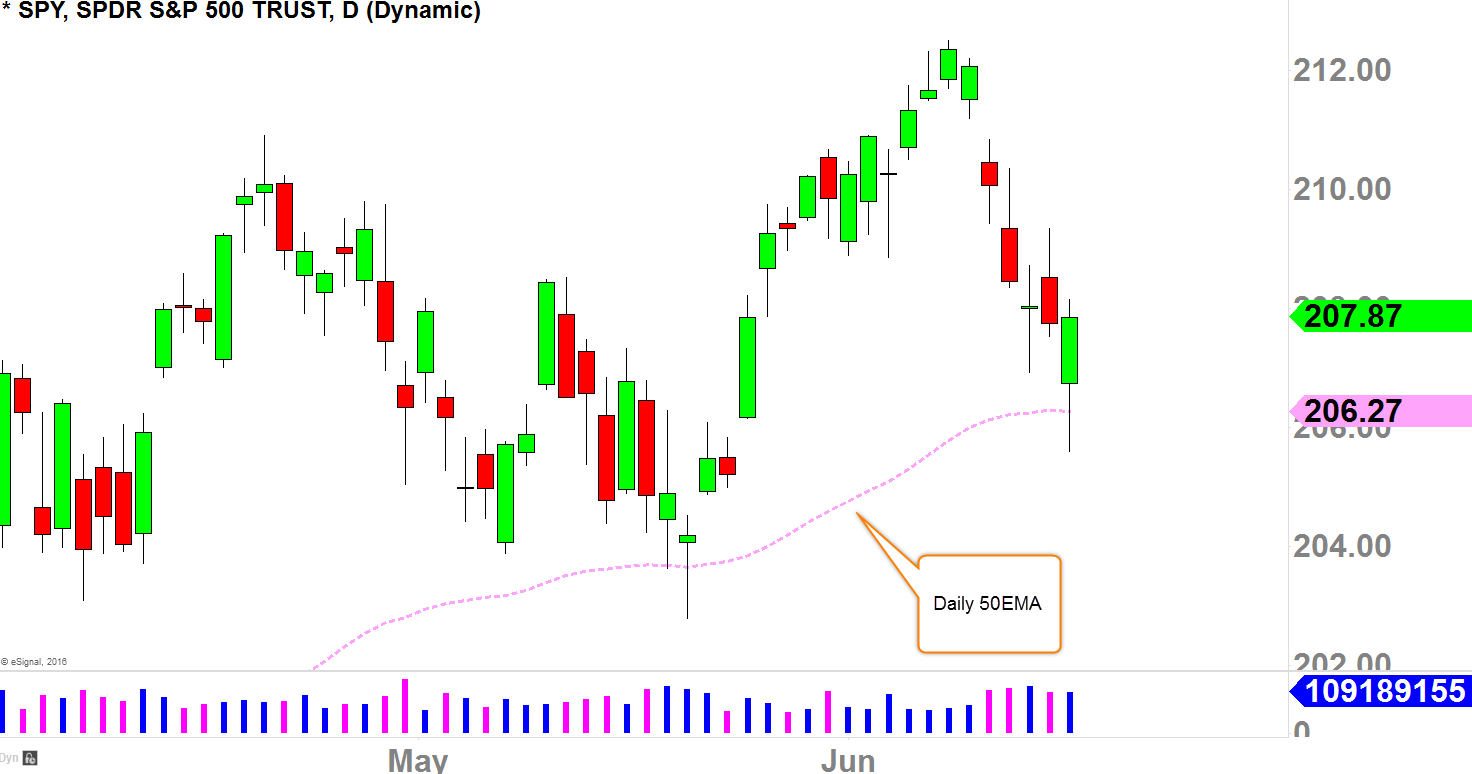
1. 50-Day Moving Average (EMA)
On my previous article (part 1) few days ago, we didn't quiet hit the 50EMA, but today we are bouncing off of that 50EMA.
Keep in mind though, 10/20EMAs are still declining (not shown in the chart), buyers would need to reclaim those Moving Averages to the upside to shift the sentiment back to "bullish." 
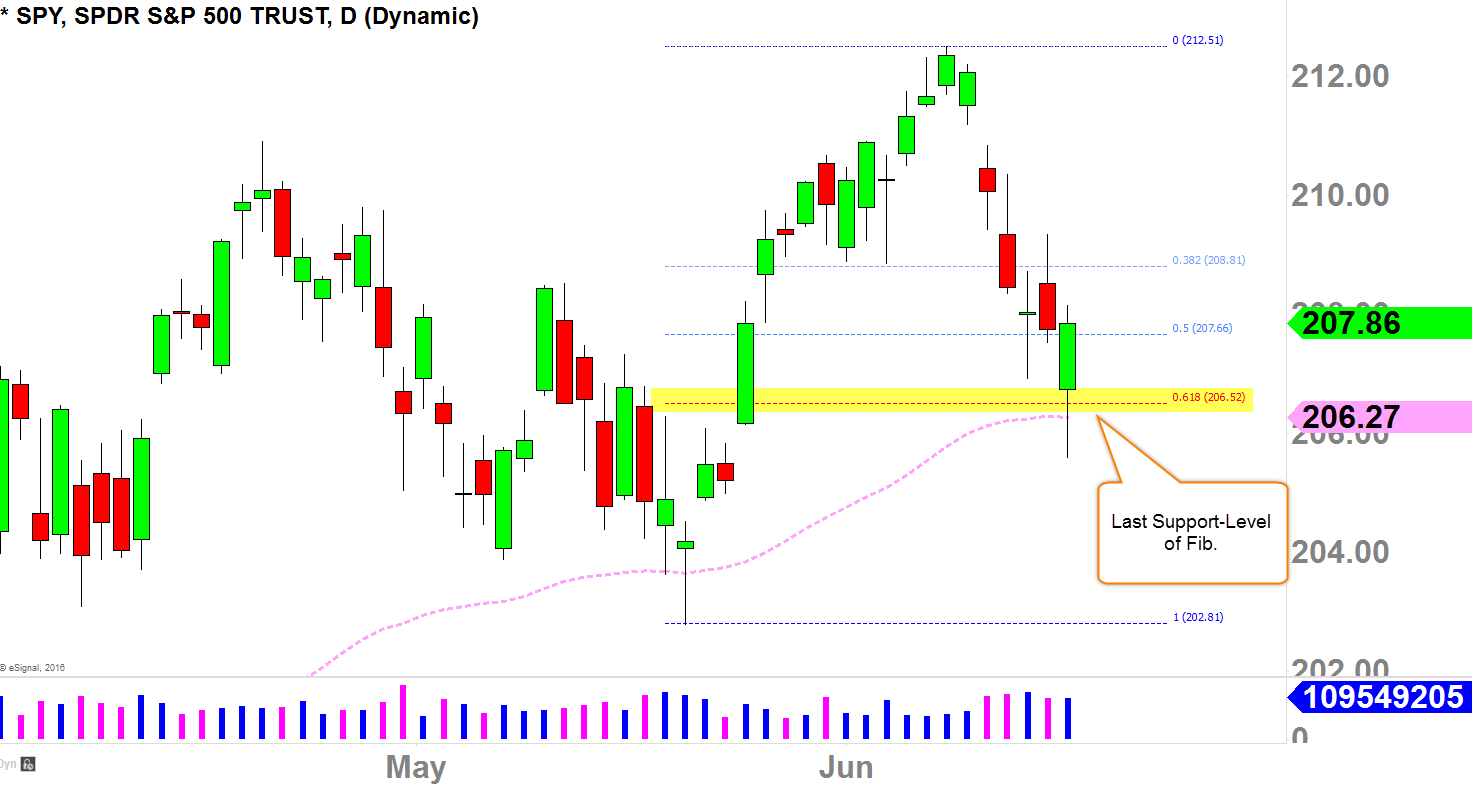
2. Fib. Support-Level
We are seeing pretty firm bounce right on that last support-level of Fibonacci Retracement Zone.
This is the level buyers want to protect if they want to see a continuation-move to the upside. 
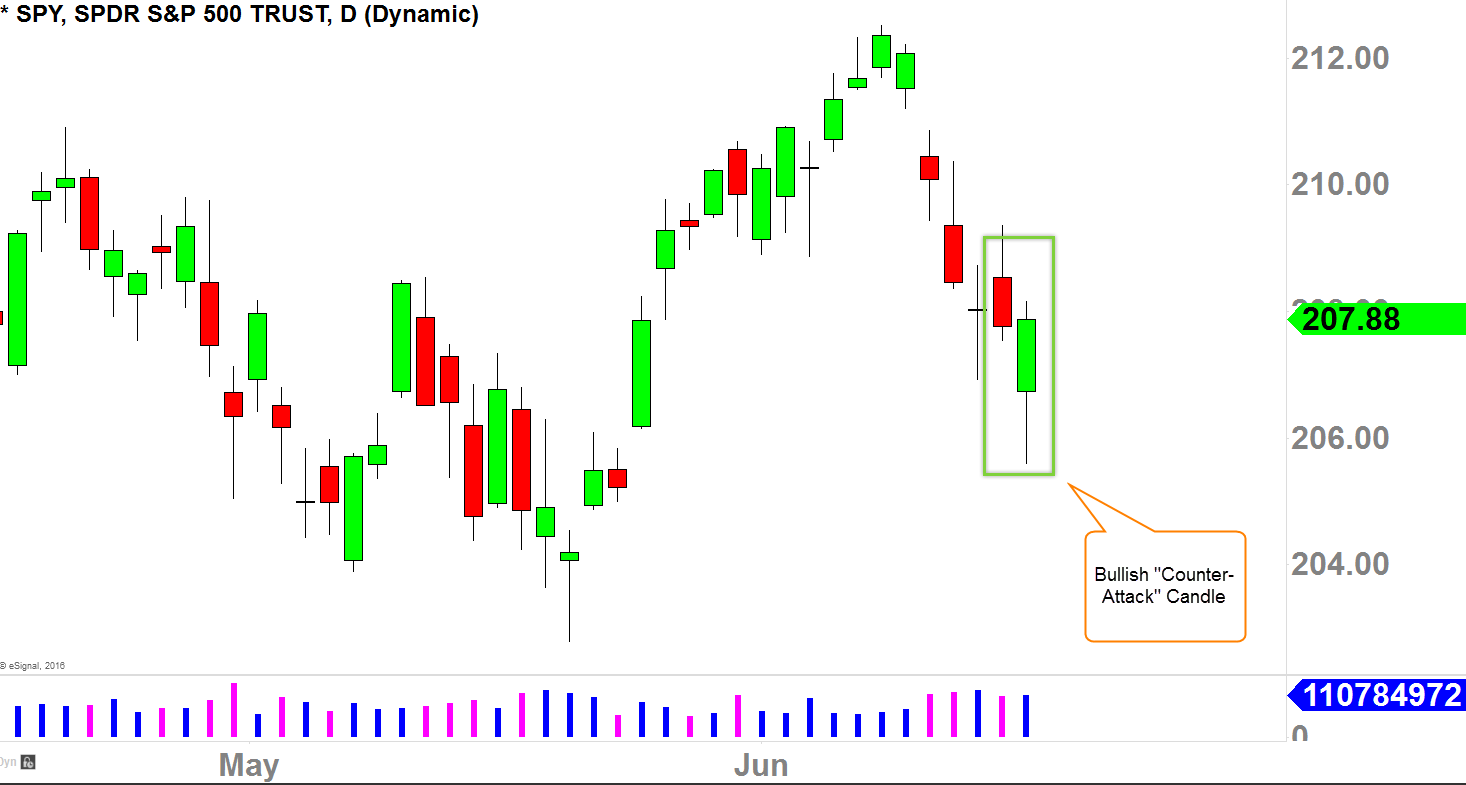
3. Reversal Candle
This is what we call a bullish Counter-Attack candle.
"Counter attack" comes from Japanese Candle Charting Technique; because it gaps down in the morning where it seems as though sellers are in full control, but towards end of the day, buyers bring the prices back up (hence the word "counter attack") and closes the day near the previous day's close.
If we can see a follow-through move to the upside in the next few days, this reversal candle will be confirmed. 
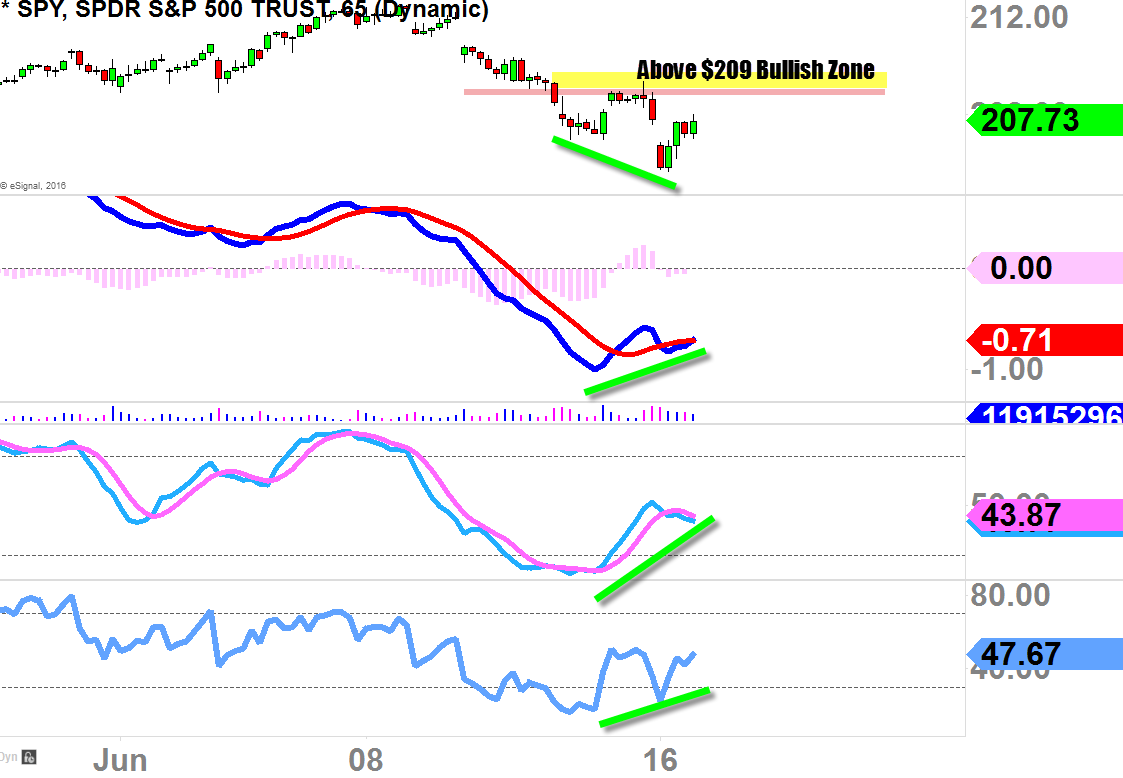
Bonus Chart: Bullish Divergence
Price-action creates lower-low while the oscillators create higher-low; this is a classic bullish-divergence formation to gauge minor-term outlook on the 65mins-chart. It will be confirmed once the price-action gets well-above the $209 zone as annotated below. 
