Investing.com’s stocks of the week
1. Rising Uptrend-Support
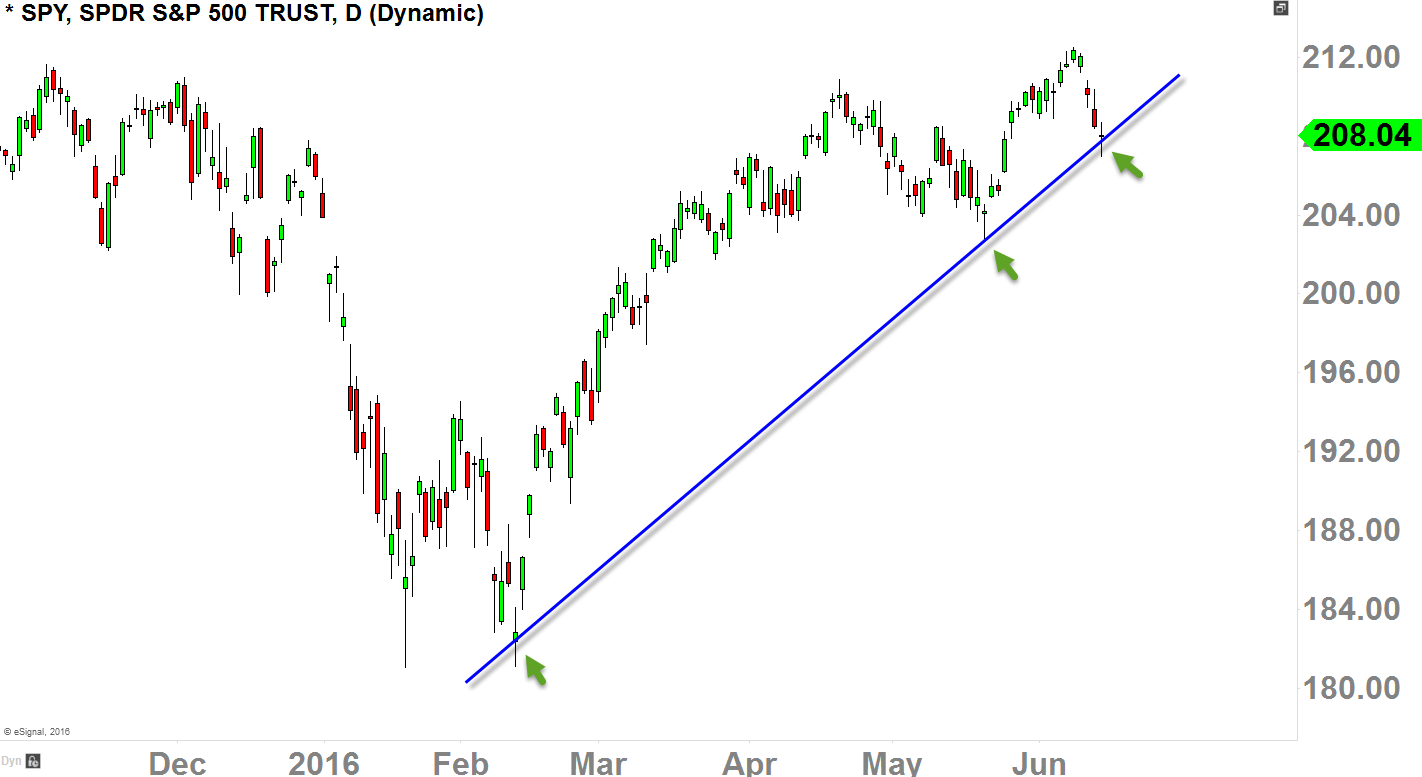
As of today SPDR S&P 500 (NYSE:SPY) is sitting right on the rising uptrend-support; this does not mean it must bounce here, but it could mean that we may have a bounce coming in the foreseeable future.
I would put some weight on this trend-line in the minor-term for the fact that the market respected it back mid-February and late-May.

2. Rising 50-Day Moving Average (EMA)
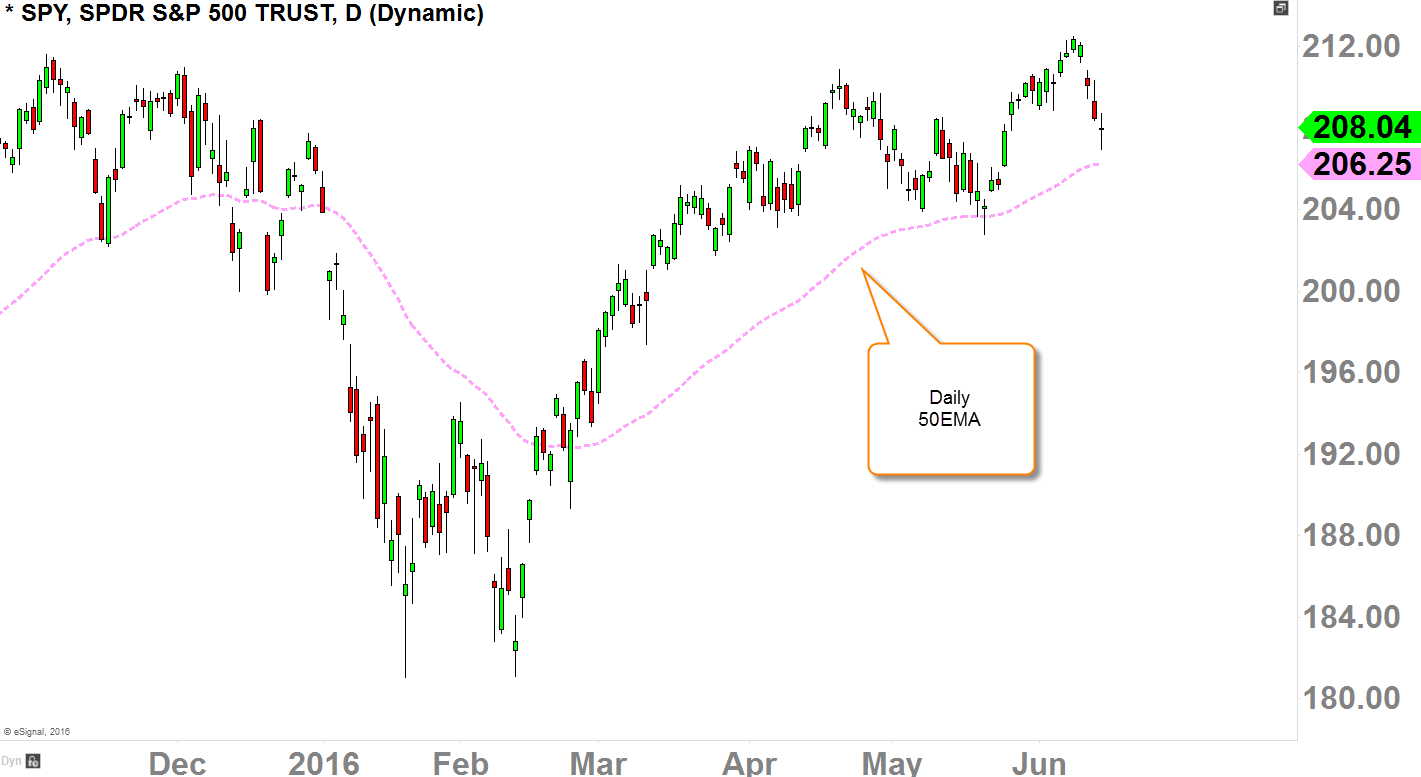
When the 50-day moving average is rising higher (as it is today), we have to give the 'benefit of the doubt' to the buyers in the intermediate term.
We can also see that (in the chart below) market bounced off of the 50-day moving average back in late-May.
Again, this does not mean that it must bounce here, but it means to watch this level closely as the buyers may flock in again.

3. Doji Candle
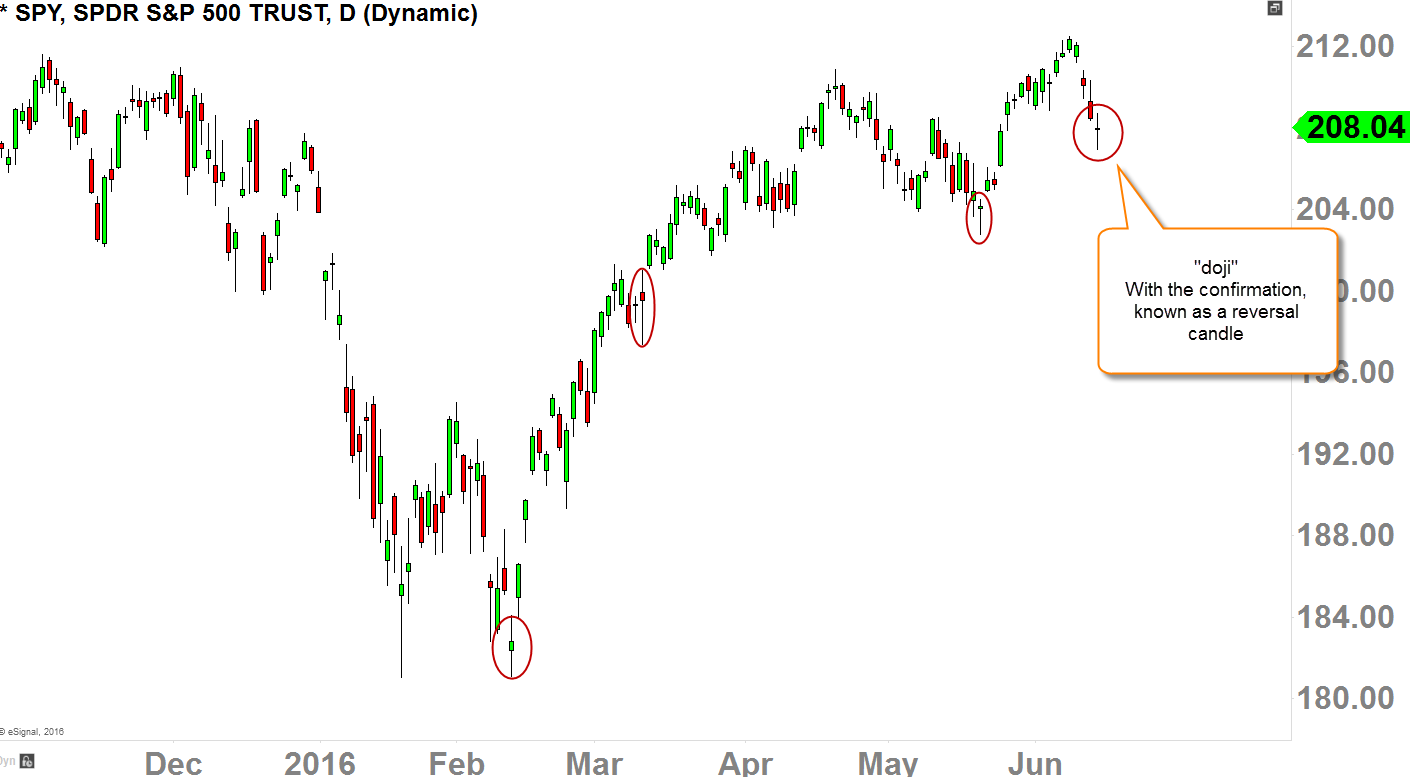
I always look at Doji candle as a 'wild card' because without a confirmation follow-through it could be a 'resting/continuation candle' and not a 'reversal candle.'
So if we can see a follow-through to the upside in the next few trading-days, only then, we can categorize this candle as a 'reversal candle.'
It's interesting though, since mid-February of this year, doji candle has been served as strong reversal candle. Let's see how the market deals with this one in the next few days.

Bonus Chart: Fib. Retracement Zone
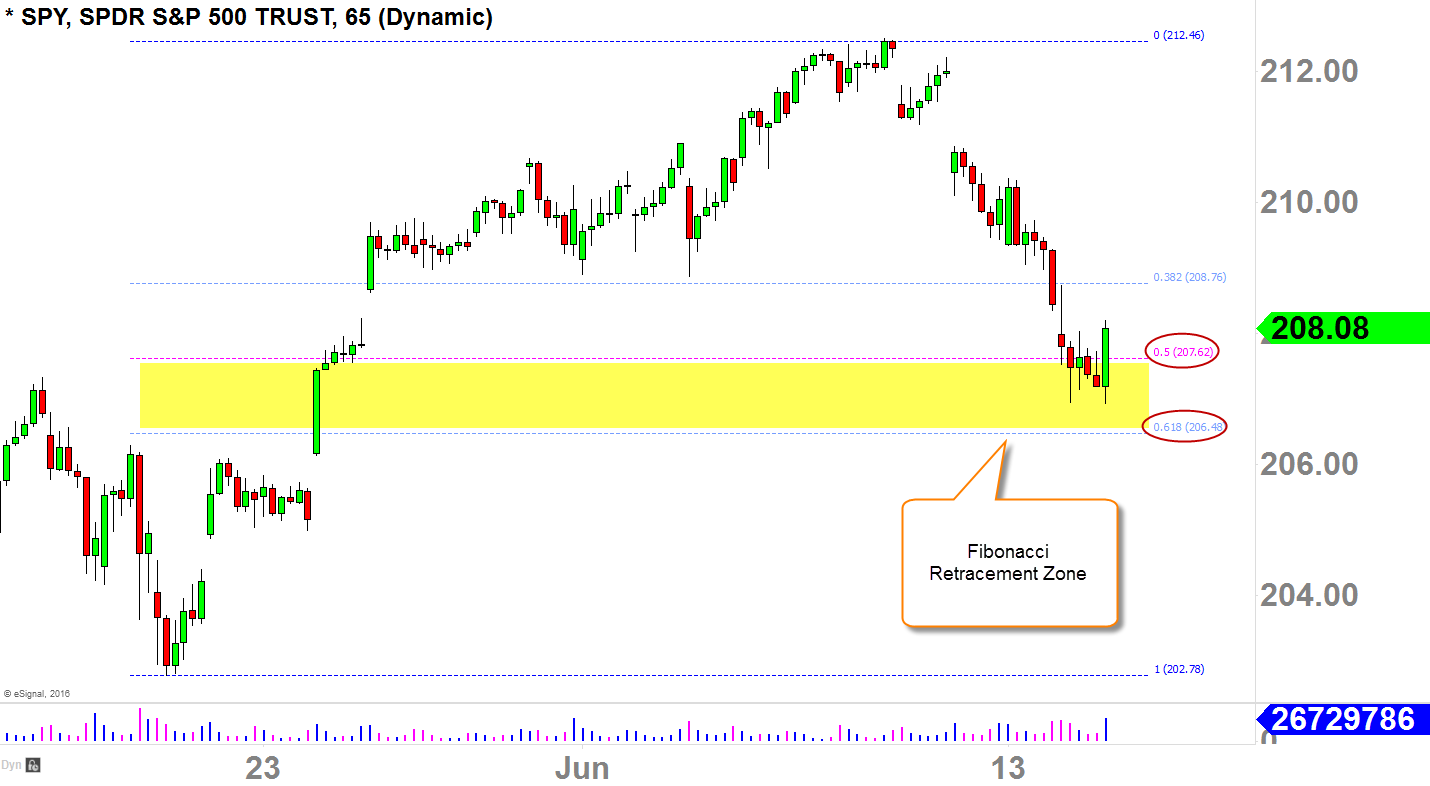
This chart is a 65-mins with Fibonacci Retracement tool.
Fibonacci theory goes, as long as it bounces on or near the 'Zone', the sentiment of the market is still bullish in the intermediate term (as we all know that the market does not go straight-up), and the market could continue higher without the conjecture.

