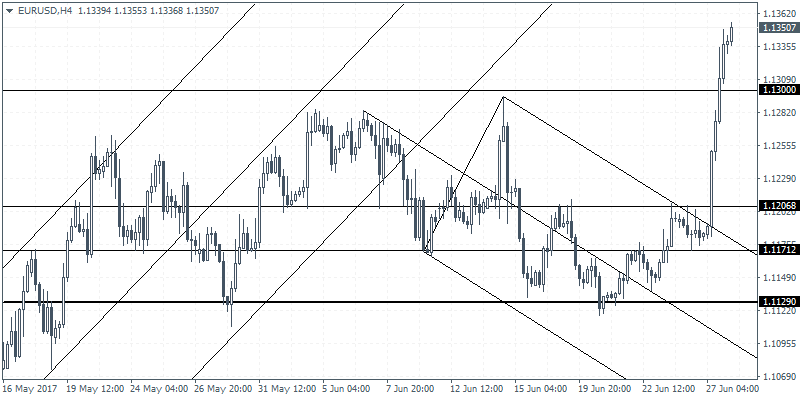
ECB President Mario Draghi was speaking in Portugal yesterday where he signaled that from September, the ECB would cut back its bond purchases from the current 60 billion euro to 40 billion euro a month. The talk of tapering sent the euro surging higher on the day, breaking past 1.1300 as a result.
Draghi also signaled that the central bank could adjust its monetary policy tools, currently at sub-zero rates. With the markets putting pressure on the ECB and expecting the hawkish talk, the euro rallied strongly.
Elsewhere, the economic calendar included a late evening speech from Janet Yellen at the British Academy in London. She did not go into much details about the Fed's monetary policy, but Yellen signaled that major banks were in a much stronger position than before. She also said that it was unlikely for the financial crisis to occur.
Looking ahead, the economic data includes continued speeches from major central bank officials. Thisincludes, ECB's Mario Draghi, BoC President Poloz, Mark Carney and BoJ President Kuroda.
EUR/USD intraday analysis

EUR/USD (1.1350): With the EUR/USD posting strong gains and rising above 1.1300, the price action looks bullish from here. Further gains could be seen coming with any pullbacks limited to 1.1300. However, in terms of the fundamentals, there is scope for the common currency to give up its gains especially with this Friday's flash inflation estimates. Therefore, the current gains in EUR/USD could be seen as a rally led by market expectations. With a good two months to go, there is scope for the ECB to readjust its forward guidance as well. In the near term, EUR/USD remains poised to the upside with initial support seen at 1.1300.
GBP/USD intraday analysis

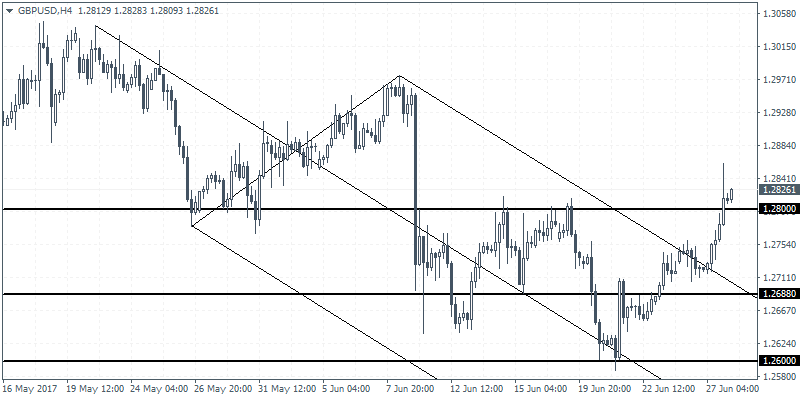
GBP/USD (1.2826): The British pound extended the gains back to 1.2800 yesterday and slightly closing above this resistance level. Any pullback off this resistance level could see GBP/USD post some declines back to 1.2660 region, where the right shoulder of the inverse head and shoulders pattern could be formed. This would suggest further upside in price. GBP/USD has scope for afurther rally towards 1.3200 at the minimum. The falling median line also shows that price action will need to post a higher low ahead of further gains.
USD/JPY intraday analysis

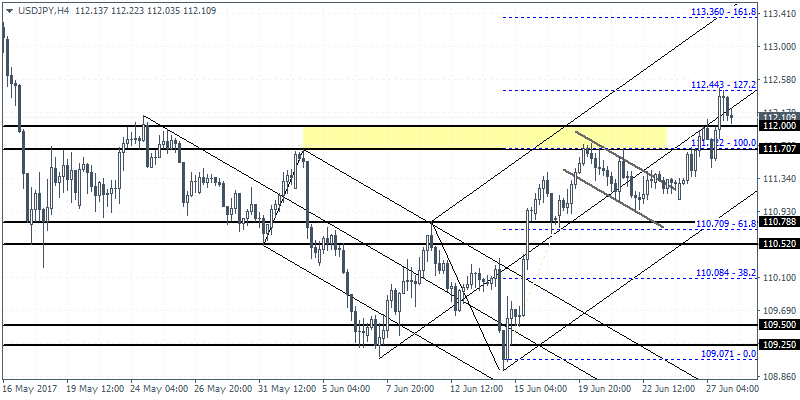
USD/JPY (112.10) also closed higher on the day surprisingly, despite the weakness in the US dollar. With price lingering near the resistance level of 111.61, there is scope for a pullback in price. Support has now moved up to 111.72 level. This marks the top of the bull flag rally. Yesterday's gains towards 112.44 marked the 127.2% Fibonacci extension level of the bull flag pattern. The next target remains at 113.36 with the pullback to the support at 111.72 likely to limit the declines.
