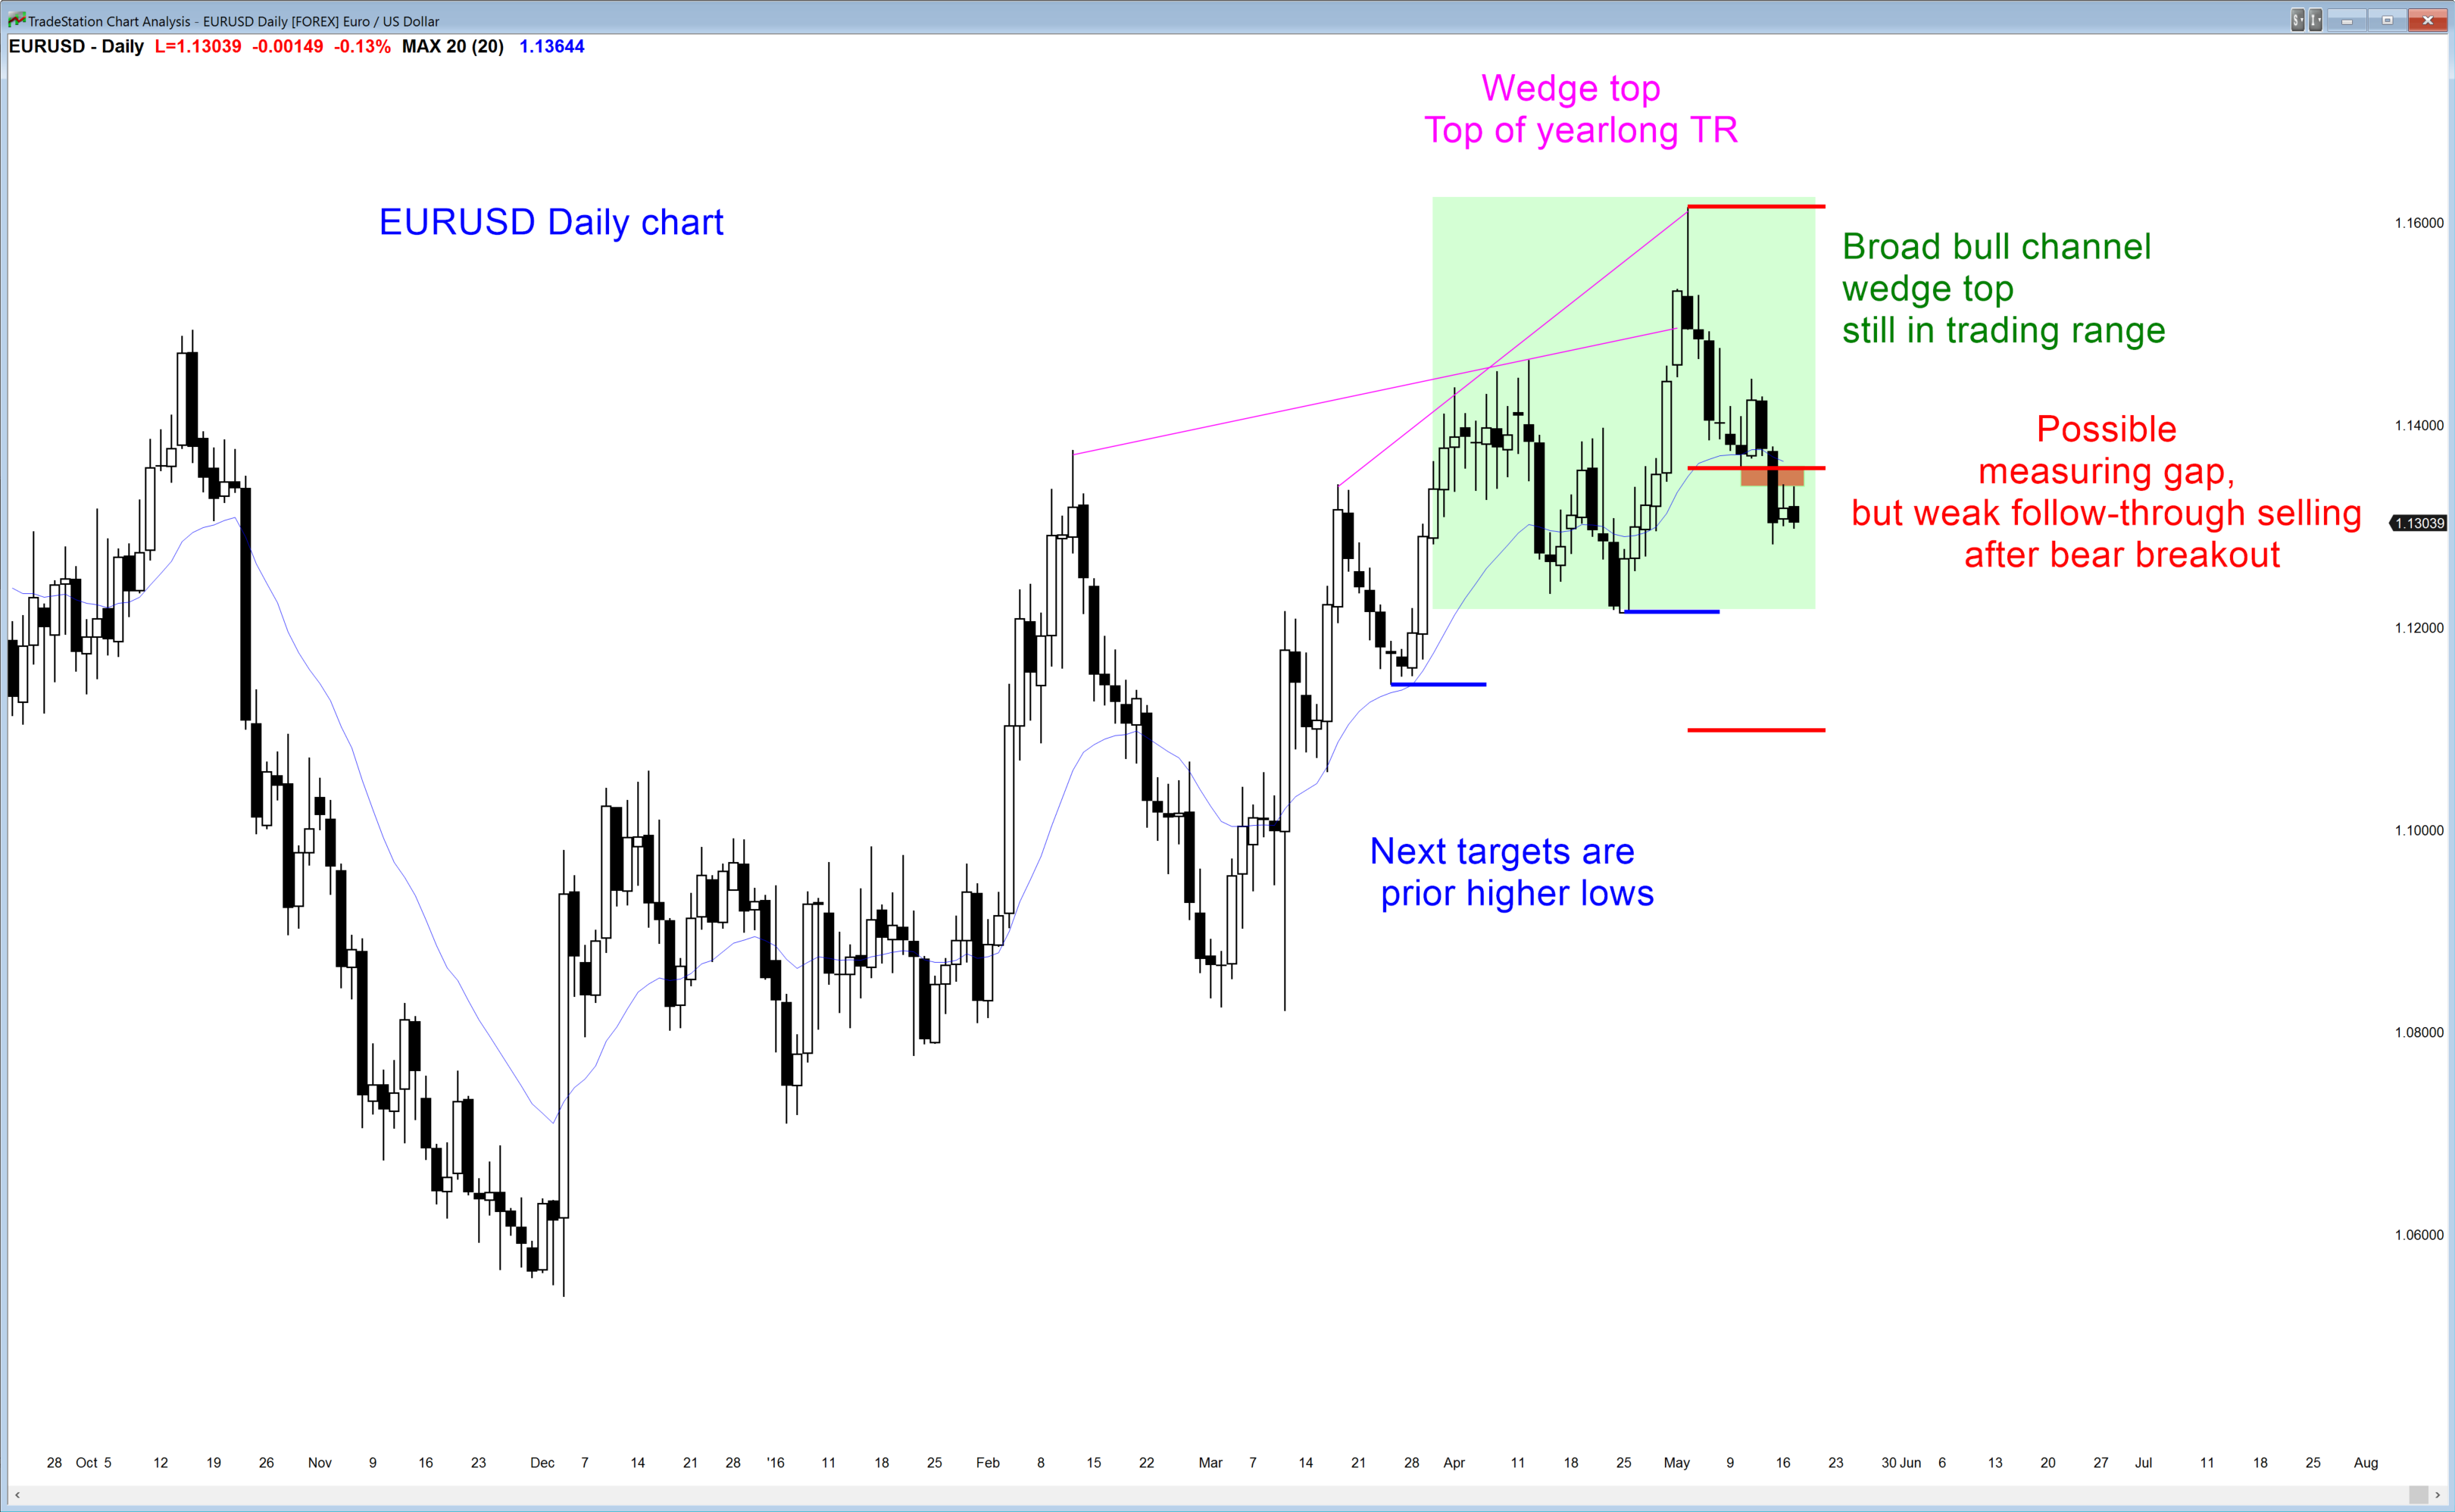
The daily EUR/USD has been sideways for 6 weeks. All trading ranges contain tops and bottoms. The bulls see a broad bull channel. The bears see a wedge top. [Note that yesterday's chart was a 20-, not a 120-minute chart]
The EUR/USD daily chart has been sideways for a couple of months. It is still forming higher lows and is still in a broad bull channel. It had a wedge top 3 weeks ago and 2 small legs down. When the legs are in a tight channel like that, they are usually part of the 1st leg of a bigger 2 legged pullback. The daily chart is neutral and in breakout mode.
It had a bear breakout on Friday. Instead of today showing strong follow-through selling in the form of a big bear bar, which typically happens at the start of a bear trend, yesterday was a bull doji. This is weak follow-through selling, and it is consistent with the idea that the bear breakout only has about a 40 – 50% chance of becoming a measuring gap.
The selloff might test the April 25 bottom of the most recent bull leg at around 1.1214 (the most recent higher low in the broad bull channel). However, the lack of consecutive big bear bars in the selloff from the May 3 wedge top make a trading range more likely than a bear trend. The EUR/USD will probably be mostly sideways for at least a week or two.
A broad bull channel needs higher lows. That April 25 higher low is therefore a magnet. The bears want to get below it so that traders will conclude that the bull trend (broad bull channel) on the daily chart as ended. Most trends are followed by trading ranges. The odds are that there are buyers below that low. However, if there is a strong bear breakout, the bears could take control.
The daily chart is in a 3 day tight trading range, and had trading range price action overnight. Online Forex day traders are still scalping, waiting for a strong breakout and follow-through.

