EUR/CAD - dynamic rebound from the support area
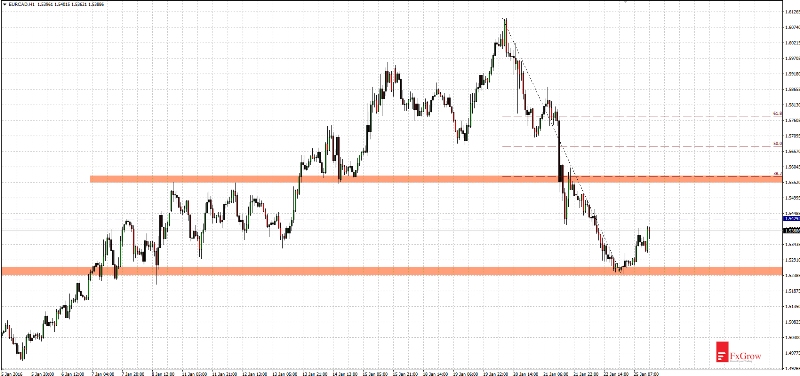
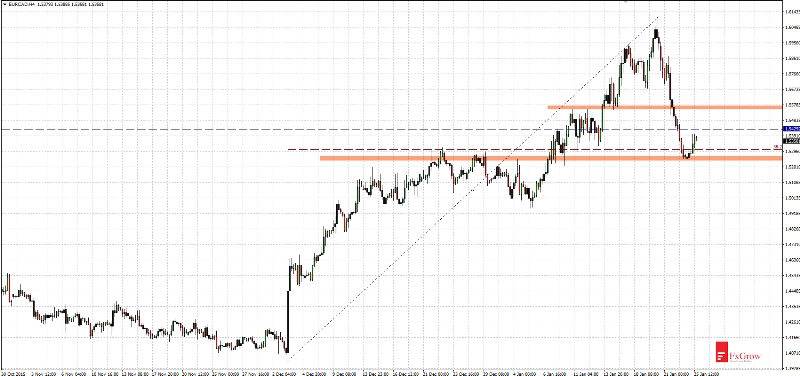
After January 20th when EUR/CAD reached 1.6100 (5 years high), dynamic rebound occurred. Falls lasted 3 days and finished at 1.5245 level which is 38,2% Fibonacci level of earlier uptrend movement. That area was additionally strengthened by the support.
Currently there is a rebound which should reach at least 1.5570 area (nearest strong resistance). Indicated resistance is important for further direction of price movement.
If demand breaks its correction may be finished and price will move to a new high. However there is an alternative scenario, when bears will go back and last week’s low will be deepened, entire downward movement will form ABC simple correction. Target for falls could be calculated by equation A=C. Nearest supports: 1.5250, 1.5100, 1.4980. Nearest resistances: 1.5430, 1.5570, 1.5680.
Time-frame H1
Time-frame H4
DISCLAIMER: This analysis is intended to provide general information and does not constitute the provision of INVESTMENT ADVICE. Investors should, before acting on this information, consider the appropriateness of this information having regard to their personal objectives, financial situation or needs. We recommend investors obtain investment advice specific to their situation before making any financial investment decision.
