Black Friday Sale! Save huge on InvestingProGet up to 60% off

Stock Bearishness Points To A Turning Point

Published 04/16/2017, 03:14 AM
Updated 07/09/2023, 06:31 AM
US500
-

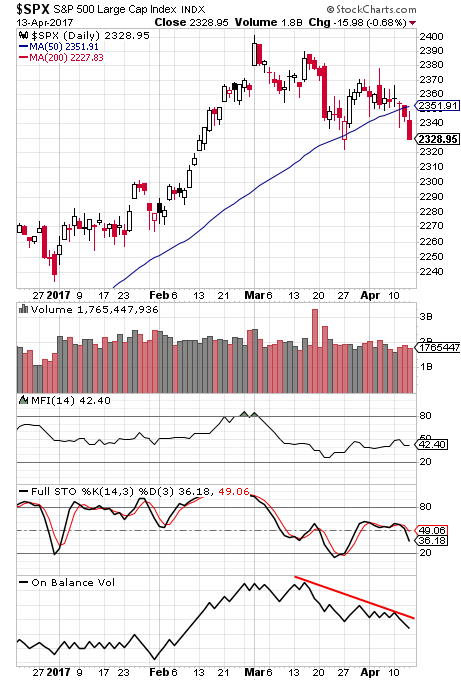
Bearish sentiment has over taken what was a bullish environment that unfolded after last year's election. The sentiment change can be attributed to a number of factors, such as continued gridlock in Washington, U.S. bombing campaigns in several countries overseas, etc. Most of the return generated by the equity market over the past two years has occurred since the election in November of last year. In spite of what seems like pervasive investor bearishness​ in stocks, the S&P 500 Index is down only 3.0% from its high at the beginning of March as can be seen in the below chart.
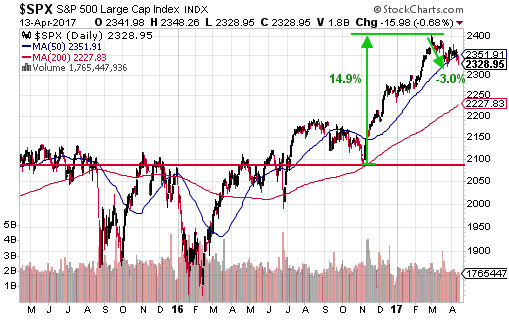
Daily S&P 500

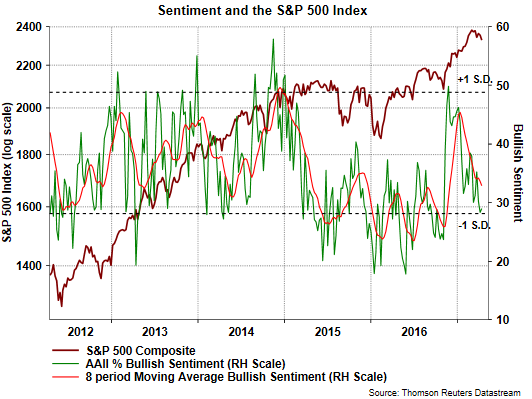
The single-digit pullback in stocks has resulted in the S&P 500 Index closing price falling below its 50-day moving average and is an indication of potential market weakness ahead. On the other hand, sentiment measures like the equity only put call ratio and the AAII sentiment survey indicate excess market bearishness as noted in the two below charts. These two sentiment measures are contrarian ones and are at levels suggesting a market turning point may be near. Both of these sentiment measures are more accurate at extreme levels. In the case of the equity P/C ratio, readings above 1.0 are indicative of an oversold market and the current .96 reading is certainly nearing that level.
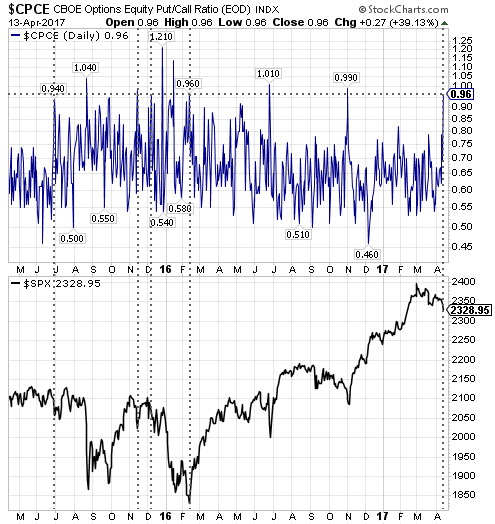
Equity Only Put Call Ratio (top), S&P 500
Stock Sentiment

Also, the single digit market pullback has resulted in the Relative Strength Index nearing an oversold level as well.
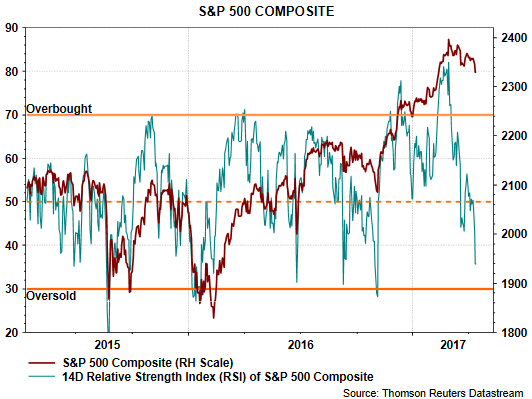
Relative Strength Nears Oversold

The deterioration in a number of these sentiment readings coincides with the recent market weakness. The last graph in the chart below shows the On Balance Volume measure (OBV) is trending lower too. OBV is a cumulative indicator that adds volume on up days and subtracts volume on down days. The trend of the indicator is what is important to evaluate and the current trend shows more volume is occurring on down days versus up days. A change in this downward trend would be an indication that the market may be at a turning point and in this case a turn to the upside.
S&P 500 Sentiment Indicators

Latest comments

Loading next article…
Risk Disclosure: Trading in financial instruments and/or cryptocurrencies involves high risks including the risk of losing some, or all, of your investment amount, and may not be suitable for all investors. Prices of cryptocurrencies are extremely volatile and may be affected by external factors such as financial, regulatory or political events. Trading on margin increases the financial risks.
Before deciding to trade in financial instrument or cryptocurrencies you should be fully informed of the risks and costs associated with trading the financial markets, carefully consider your investment objectives, level of experience, and risk appetite, and seek professional advice where needed.
Fusion Media would like to remind you that the data contained in this website is not necessarily real-time nor accurate. The data and prices on the website are not necessarily provided by any market or exchange, but may be provided by market makers, and so prices may not be accurate and may differ from the actual price at any given market, meaning prices are indicative and not appropriate for trading purposes. Fusion Media and any provider of the data contained in this website will not accept liability for any loss or damage as a result of your trading, or your reliance on the information contained within this website.
It is prohibited to use, store, reproduce, display, modify, transmit or distribute the data contained in this website without the explicit prior written permission of Fusion Media and/or the data provider. All intellectual property rights are reserved by the providers and/or the exchange providing the data contained in this website.
Fusion Media may be compensated by the advertisers that appear on the website, based on your interaction with the advertisements or advertisers.
© 2007-2024 - Fusion Media Limited. All Rights Reserved.