The yen has not been shy of volatility or technical patterns. The technical patterns have defined the recent levels the Yen has played off and traders can take advantage of these as it continues.

Source: Blackwell Trader
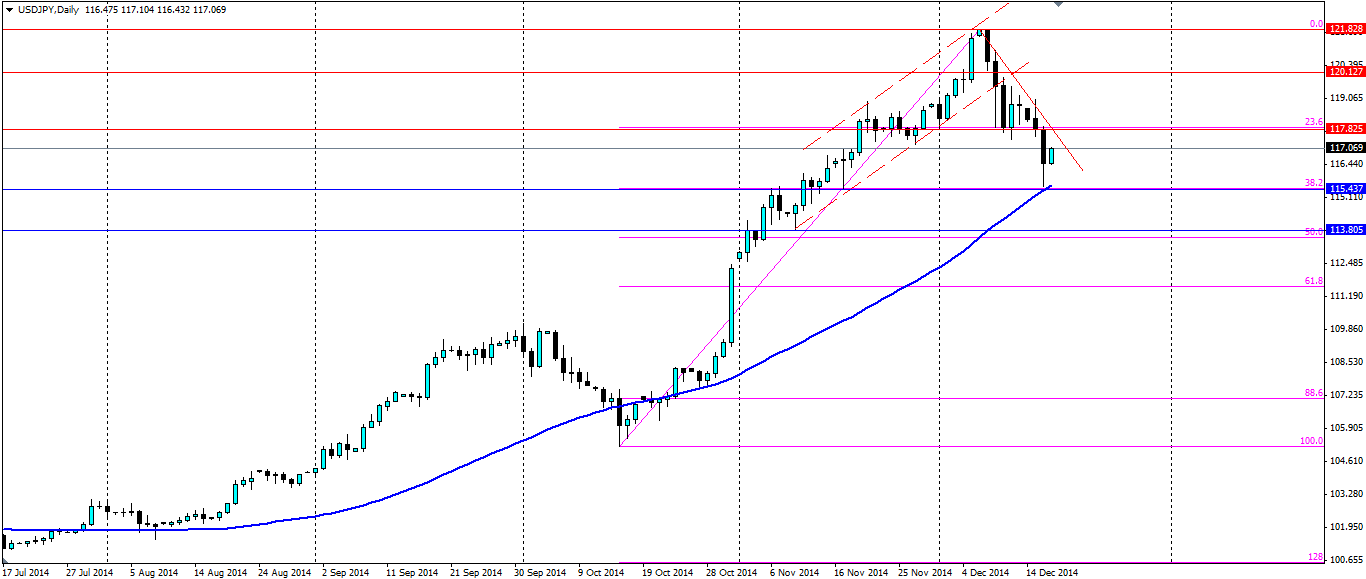
The yen has strengthened considerably from the high of 121.83 the USD/JPY pair hit just 10 days ago. Since then it has retraced back down to 115.43 with a perfect touch on the 38.2% Fibonacci line. This touch also coincides with a touch of the 50 day simple moving average and the resistance turned support it found on the way up.
The weakening of the yen was no surprise as the prospect of four more years of Abenomics will see the easing policies remain in Japan. What has been a surprise for the markets is the recent strength in the Yen. The market felt the Yen had depreciated too far, too fast, throw in falling oil prices, volatility in equities and a collapsing Russian economy and you have plenty of demand for the safe haven asset.
From here we could see the Yen push through the 38.2% fib line, in which case it will target the 50.0% line or the support slightly above it at 113.805. If that zone fails, the next target will be the 61.8% fib line.
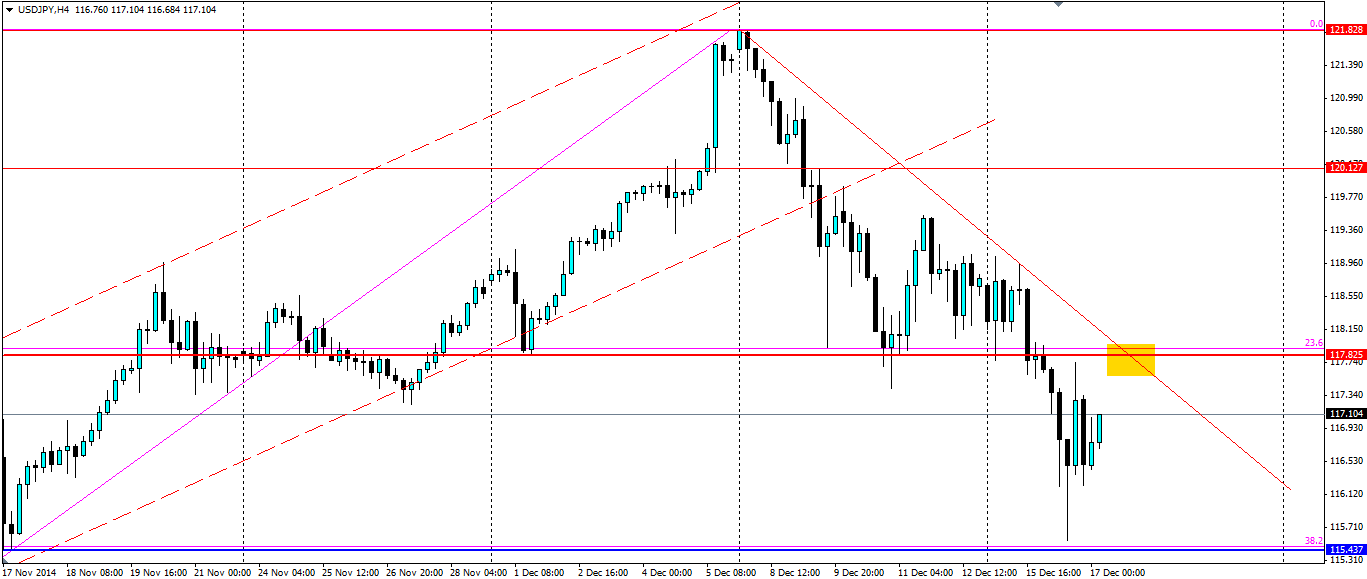
If the current pullback continues, the yen will likely target the 23.6%, or the resistance at 117.825, which has already acted as a sticking point for the price. The current bearish trend on the H4 chart below is likely to come back into play. The zone in yellow may be an interesting target for the Yen and I wouldn’t be surprised to see a large number of short positions stacked there.

The yen has looked for technical levels as it retraces from the highs found earlier this month. Regardless if it continues or looks to turn bullish, the technicals will provide traders with opportunities.
