


Sign up to create alerts for Instruments,
Economic Events and content by followed authors
Free Sign Up Already have an account? Sign In
Please try another search

It has been about a month since the last earnings report for Fortinet, Inc. (NASDAQ:FTNT) . Shares have added about 11.4% in that time frame, outperforming the market.
Will the recent positive trend continue leading up to its next earnings release, or is FTNT due for a pullback? Before we dive into how investors and analysts have reacted as of late, let's take a quick look at its most recent earnings report in order to get a better handle on the important drivers.
Fortinet Q4 Earnings Top, Revenue Growth Rate Dismal
Continuing with its upbeat performance for the sixth straight quarter, Fortinet recently reported better-than-expected results for fourth-quarter 2017, wherein revenues and earnings came ahead of the company’s expectations, and also surpassed the respective Zacks Consensus Estimate.
Fortinet’s non-GAAP earnings per share of 32 cents beat the Zacks Consensus Estimate of 29 cents. Also, earnings came in higher than management’s guidance range of 28-30 cents and marked an improvement over the year-ago quarter’s earnings of 30 cents, driven mainly by higher revenues which were partially offset by elevated operating expenses.
Quarter in Detail
Fortinet reported fourth-quarter revenues of $416.7 million, beating the Zacks Consensus Estimate of $409 million and up 14.8% year over year. Segment wise, Product revenues increased 2% year over year to $162.1 million, while Services revenues jumped 24.8% to $254.6 million. A large number of deal wins and customer additions during the reported quarter also proved conducive to top-line growth.
During the fourth quarter, the company witnessed 21% year-over-year growth in the number of deals worth more than $100,000, while the number of deals worth more than $250,000 and $500,000 climbed 31% and 24%, respectively.
Billings were up 15% on a year-over-year basis to $534 million.
Non-GAAP (excluding stock-based compensation and amortization of intangible assets) gross profit jumped 14.4% from the year-ago quarter to $313.9 million. However, gross margin contracted 40 basis points (bps) to 75.3%. It also came in below the mid-point of management’s expectation of 75-76% (mid-point 75.5%).
Furthermore, non-GAAP operating expenses jumped 21.6% year over year to $235.3 million. As a percentage of revenues, non-GAAP operating expenses advanced 320 bps year over year to 56.5%.
Non-GAAP operating profit declined 3% to $78.7 million from approximately $81.1 million recorded in the year-ago quarter. Non-GAAP operating profit margin contracted 350 bps to 18.9%, mainly due to lower gross margin and escalating operating expenses as a percentage of revenues which more than offset the benefit of higher revenues. Operating margin, however, came at the higher-end of the company’s guidance range of 18-19%.
Balance Sheet & Cash Flow
Fortinet exited the reported quarter with cash and cash equivalents, and short-term investments of approximately $1.25 billion, down from $1.28 billion recorded at the end of the third quarter. Accounts receivable were $346.2 million compared with $258 million witnessed at the end of the previous quarter.
During the year, the company generated operating cash flow of $594.4 million. Free cash flow for 2017 came in at $459.1 million. Fortinet bought back 11.2 million shares for $446.3 million during the year.
Guidance
Fortinet initiated outlook for first-quarter and full-year 2018.
The company’s forecasts for the first quarter are slightly lackluster. Management expects revenues in the range of $387-$393 million (mid point: $390 million). Billings are estimated in the range of $449-$457 million.
Non-GAAP earnings per share are anticipated to come in the band of 21-22 cents (mid point: 21.5 cents). The guidance range represents a year-over-year increase of 26.4%. Non-GAAP gross margin is estimated in the range of 75-76%, whereas non-GAAP operating margin is projected to be between 12% and 13%.
For 2018, management projects revenues in the range of $1.695-$1.715 billion (mid-point: $1.705 billion). Billings are forecast in the band of $2.030-$2.050 billion.
Nevertheless, the company anticipates that its cost-management initiatives will drive margins and earnings per share. Non-GAAP gross and operating margin projections are in the range of 75-76% and 17.7-18%, respectively.
Non-GAAP earnings per share are estimated to lie between $1.30 and $1.32 (mid-point $1.31).
How Have Estimates Been Moving Since Then?
In the past month, investors have witnessed an upward trend in fresh estimates. There have been three revisions higher for the current quarter compared to one lower. While looking back an additional 30 days, we can see even more upward momentum. There have been three moves up in the last two months.
VGM Scores
At this time, FTNT has an average Growth Score of C, however its Momentum is doing a lot better with an A. However, the stock was allocated a grade of F on the value side, putting it in the fifth quintile for this investment strategy.
Overall, the stock has an aggregate VGM Score of D. If you aren't focused on one strategy, this score is the one you should be interested in.
Our style scores indicate that the stock is more suitable for momentum investors than growth investors.
Outlook
Estimates have been broadly trending upward for the stock and the magnitude of these revisions looks promising. It comes with little surprise FTNT has a Zacks Rank #2 (Buy). We expect an above average return from the stock in the next few months.
Shares of Alibaba (NYSE:BABA) are on a tear to start off 2025. The consumer discretionary and tech stock is up by 52% this year as of the Feb. 25 close. The company’s cloud...
Every investor should know the term CEP, or customer engagement platform, because it is central to businesses' use of AI. CEPs provide software services to connect and communicate...
As markets try to look through the blizzard of policy changes flowing out of Washington, the crowd has shifted its preferences considerably in recent weeks based on a sector lens....
Are you sure you want to block %USER_NAME%?
By doing so, you and %USER_NAME% will not be able to see any of each other's Investing.com's posts.
%USER_NAME% was successfully added to your Block List
Since you’ve just unblocked this person, you must wait 48 hours before renewing the block.
I feel that this comment is:
Thank You!
Your report has been sent to our moderators for review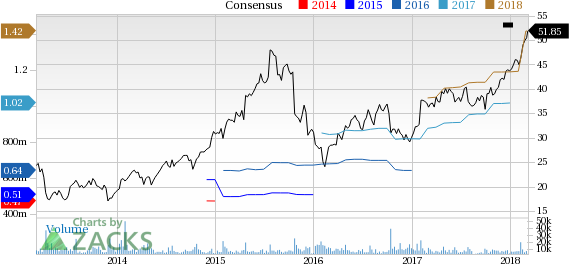

Add a Comment
We encourage you to use comments to engage with other users, share your perspective and ask questions of authors and each other. However, in order to maintain the high level of discourse we’ve all come to value and expect, please keep the following criteria in mind:
Enrich the conversation, don’t trash it.
Stay focused and on track. Only post material that’s relevant to the topic being discussed.
Be respectful. Even negative opinions can be framed positively and diplomatically. Avoid profanity, slander or personal attacks directed at an author or another user. Racism, sexism and other forms of discrimination will not be tolerated.
Perpetrators of spam or abuse will be deleted from the site and prohibited from future registration at Investing.com’s discretion.