


Sign up to create alerts for Instruments,
Economic Events and content by followed authors
Free Sign Up Already have an account? Sign In
Please try another search

A month has gone by since the last earnings report for Cirrus Logic, Inc. (NASDAQ:CRUS) . Shares have added about 1.8% in that time frame, outperforming the market.
Will the recent positive trend continue leading up to its next earnings release, or is CRUS due for a pullback? Before we dive into how investors and analysts have reacted as of late, let's take a quick look at its most recent earnings report in order to get a better handle on the important catalysts.
Cirrus Logic Posts Dismal Q3 Earnings
Cirrus Logic reported dismal results for third-quarter fiscal 2018. The company reported non-GAAP earnings per share of $1.59 per share, which fell short of the Zacks Consensus Estimate of $1.77 per share and also declined 15% year over year.
Quarter Details
Total revenues decreased approximately 7.7% year over year to $482.7 million and also missed the Zacks Consensus Estimate of $532 million. Moreover, revenues fell short of the guided range $510-$550 million (mid-point $530 million) as well.
Management primarily attributed the lower-than-expected results to sudden decrease in demand for smartphones in the later part of December.
Segment wise, Portable audio product revenues (90.9% of the total revenues) came in at $438.7 million, down 9.3% year over year. Meanwhile, non-portable audio and other products (9.1%) increased 3.2% year over year and came in at $44.1 million.
Non-GAAP gross profit was $235.5 million, which increased 11.3% on a year-over-year basis. However, as a percentage of revenues, the figure was almost flat compared with the year-ago quarter.
Non-GAAP operating expenses increased 17.9% on a year-over-year basis to $107.9 million. As a percentage of revenues, the same increased 490 bps from the year-ago quarter to 22.3%. This in turn negatively impacted operating results.
Cirrus Logic’s non-GAAP operating income was $127.6 million, down 22.2% year over year, primarily due to higher operating expenses. Also, operating margin contracted 490 bps on a year-over-year basis and came in at 26.4%.
On a non-GAAP basis, Cirrus Logic reported net income of $104.2 million compared with $124.7 million reported in the year-ago quarter. This marked a decline of 16.5%.
The company exited the quarter with cash, cash equivalents and marketable securities of $239.5 million compared with $195.6 million at the end of the previous quarter. Accounts receivables were $217.6 million compared with $232.4 million in the last quarter. Notably, it did not have any long-term debt during the quarter.
Its board of directors authorized the repurchase of up to an additional $200 million of the company's common stock in addition to the $60.2 million remaining from previous share authorization in October 2015.
Guidance
Cirrus Logic provided guidance for fourth-quarter fiscal 2018. Notably, the lowered demand for smartphones has resulted in tepid outlook. For the fourth quarter, the company expects revenues in the range of $300–$340 million (mid-point $320 million). The company predicts GAAP gross margin to be in the range of 48-50%. Combined GAAP R&D and SG&A expenses are anticipated within $130 million and $136 million.
How Have Estimates Been Moving Since Then?
In the past month, investors have witnessed a downward trend in fresh estimates. There have been three revisions lower for the current quarter.
Cirrus Logic, Inc. Price and Consensus
VGM Scores
At this time, CRUS has a nice Growth Score of B, a grade with the same score on the momentum front. Charting a somewhat similar path, the stock was allocated a grade of A on the value side, putting it in the top quintile for this investment strategy.
Overall, the stock has an aggregate VGM Score of A. If you aren't focused on one strategy, this score is the one you should be interested in.
Based on our scores, the stock is more suitable for value investors than those looking for growth and momentum.
Outlook
Estimates have been broadly trending downward for the stock and the magnitude of these revisions indicates a downward shift. It's no surprise CRUS has a Zacks Rank #5 (Strong Sell). We expect a below average return from the stock in the next few months.
Shares of Alibaba (NYSE:BABA) are on a tear to start off 2025. The consumer discretionary and tech stock is up by 52% this year as of the Feb. 25 close. The company’s cloud...
Every investor should know the term CEP, or customer engagement platform, because it is central to businesses' use of AI. CEPs provide software services to connect and communicate...
As markets try to look through the blizzard of policy changes flowing out of Washington, the crowd has shifted its preferences considerably in recent weeks based on a sector lens....
Are you sure you want to block %USER_NAME%?
By doing so, you and %USER_NAME% will not be able to see any of each other's Investing.com's posts.
%USER_NAME% was successfully added to your Block List
Since you’ve just unblocked this person, you must wait 48 hours before renewing the block.
I feel that this comment is:
Thank You!
Your report has been sent to our moderators for review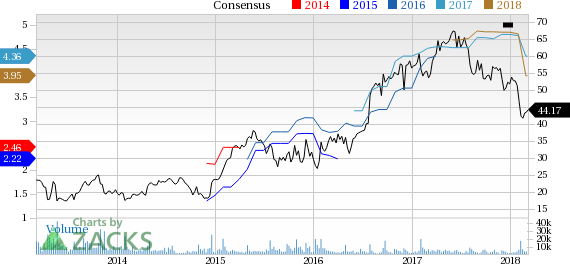

Add a Comment
We encourage you to use comments to engage with other users, share your perspective and ask questions of authors and each other. However, in order to maintain the high level of discourse we’ve all come to value and expect, please keep the following criteria in mind:
Enrich the conversation, don’t trash it.
Stay focused and on track. Only post material that’s relevant to the topic being discussed.
Be respectful. Even negative opinions can be framed positively and diplomatically. Avoid profanity, slander or personal attacks directed at an author or another user. Racism, sexism and other forms of discrimination will not be tolerated.
Perpetrators of spam or abuse will be deleted from the site and prohibited from future registration at Investing.com’s discretion.