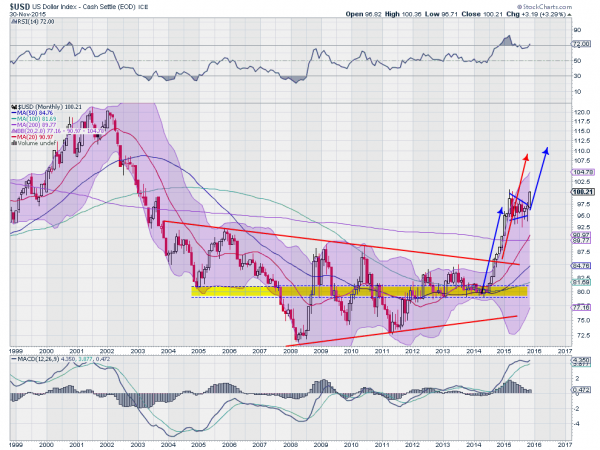
The US Dollar Index ran higher through the back half of 2014, up to 100 before consolidating. That move broke out of a 10 year consolidation. There are all sorts of macro reasons for the move: the Fed shift to talking about tightening, the ECB easing policy, recession talk and QE in Japan, continued delays in the Bank of England’s ability to raise rates, and most recently the slow down in the Chinese economy to name a few. In short, the US economy is cruising along, without overheating while the rest of the world is faltering. This makes dollar assets attractive.
History shows that these moves tend to run in 7 year cycles, and if this one is true to form then it still has almost 6 years to go. That could take it a lot higher. I have written about the long term attractiveness of the dollar many times in this space. So today lets focus on what just happened, it was big. Did you notice? Take a look.

Look closely at the price action for November. The last candlestick. After a 9 month churn, the index broke out of consolidation to the upside. And it finished at the high for the month. This Marubozu candle is extremely bullish, especially in the monthly candle. King Dollar woke up. The break of that consolidation sets a target higher of about 111. But remember that larger consolidation over 10 years? That was a symmetrical triangle and the the break above that targets a move to 107. Two targets in the short run 7 and 11% higher.
How do you trade this? Several ways. Buy the US Dollar Index ETF (N:UUP). Sell the currency ETFs of those loser countries, and buy local currency stock ETF’s of those loser countries. Good luck to you.
DISCLAIMER: The information in this blog post represents my own opinions and does not contain a recommendation for any particular security or investment. I or my affiliates may hold positions or other interests in securities mentioned in the Blog, please see my Disclaimer page for my full disclaimer.
