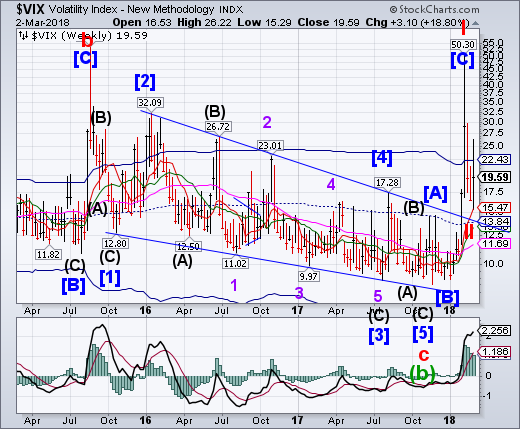
VIX expanded its retracement to 83.8% in the three week period since its high.What seems to be missed is the daily key reversal that has put the VIX back on a buy signal. The next Cycle Top may occur in the next 2-3 weeks.
(ZeroHedge) Two months ago, we detailed what the current Fed Chair (then a mere mortal) Jay Powell said during the October 23-24, 2012 FOMC meeting - just one month after the Fed announced QE3, as exposed by recently released FOMC transcripts:
[W]hen it is time for us to sell, or even to stop buying, the response could be quite strong; there is every reason to expect a strong response. So there are a couple of ways to look at it. It is about $1.2 trillion in sales; you take 60 months, you get about $20 billion a month. That is a very doable thing, it sounds like, in a market where the norm by the middle of next year is $80 billion a month. Another way to look at it, though, is that it’s not so much the sale, the duration; it’s also unloading our short volatility position.
SPX also makes a weekly key reversal.
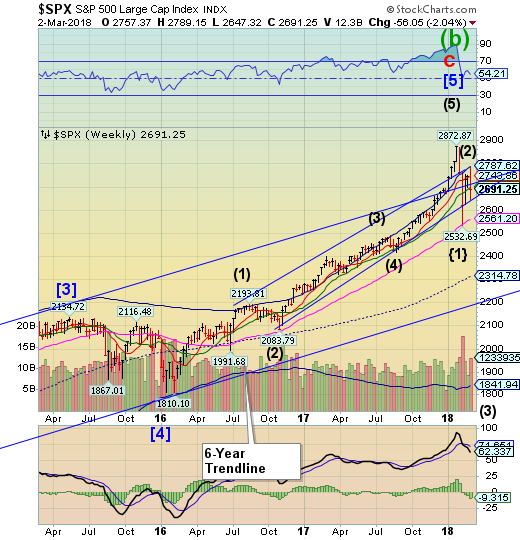
SPX made a wide-ranging pattern known as a key reversal. It closed beneath the upper long-term trendline at 2726.01andthe prior week low.Should the lower short-term trendline at 2675.00 be broken, Long-term support at 2569.73 may be tested./The fractal model suggests that the first test of the lows may bounce at Long-term support without breaking the low, but there may be multiple tests of that support…
(CNBC) U.S. stocks closed well off session lows on Friday, helped by a sharp rise in health care shares.
The S&P 500 ended 0.5 percent higher at 2,691.25 after falling more than 1 percent. Health care sector was the best-performing sector, gaining 1 percent. Shares of Universal Health Services and Perrigo were among the best-performers in the index.
The Nasdaq composite rose 1.1 percent to 7,257.87 as the iShares Nasdaq Biotechnology (NASDAQ:IBB)advanced 2.4 percent. At its low, the Nasdaq fell as much as 1.3 percent.
The Dow Jones industrial average closed 70.92 points lower at 24,538.06 after falling as much as 391 points. Johnson & Johnson (NYSE:JNJ) and Merck (NYSE:MRK) were among one of the best-performing stocks in the index, rising 1.2 percent each.
NDX also has a volatile week.
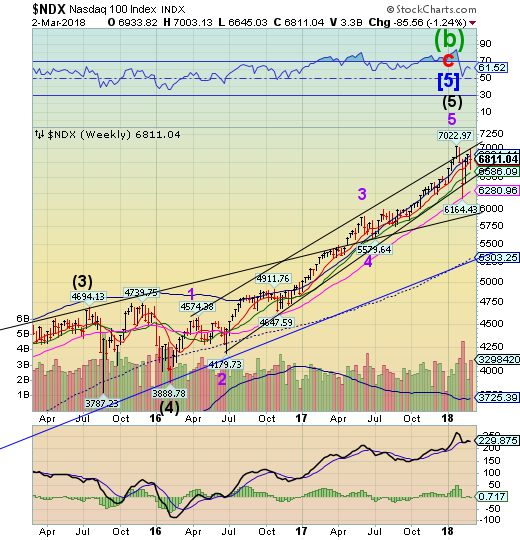
The NDXalso had a wide-ranging week, but did not close beneath the prior week low. However, the test of the upper trendline of the two-year channel failed.This implies a retest of the February 9 low.The Fractal Model also suggests that Long-term support at 6280.96 may be tested again..
(ZeroHedge) As the recent swoon in the S&P showed, the lasting pain from the February vol unwind has combined with multiple policy shocks to weigh on markets.
However, while the early Feb swoon was largely the result of the "Quant Quake", the transmission mechanism in this move lower is no longer systematic funds / vol target strategies, according to Morgan Stanley (NYSE:MS)'s Chris Metli. Instead, the MS executive director notes that this time selling has come from more fundamental/discretionary investors – the MS PB Content team has noted that there were multiple large sell days from L/S HFs this week (versus buying the week of Feb 5th ) – exacerbated by a lack of liquidity.
Here the lack of liquidity is important.
High Yield Bond Index swings between support and resistance.
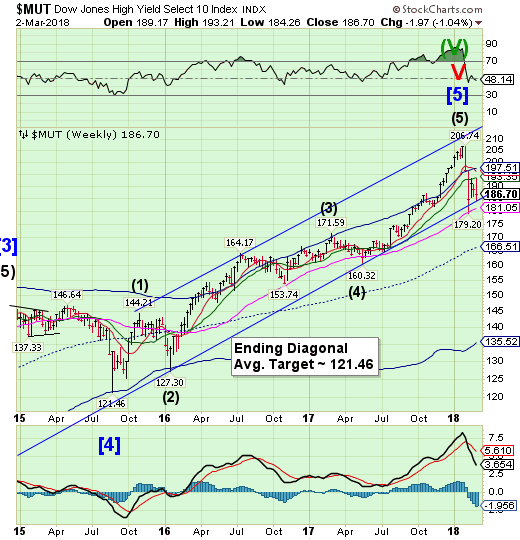
The High Yield Bond Index rallied to Intermediate-term resistance at 193.35, then sold off to the trendline at 184.00.The sell signal remains and the Cycles Model suggests that Long-term support at 181.05 may be broken this week.
(Barrons) There’s something funny in the high-yield bond market, and even Martin Fridson isn’t quite sure what it means—though he does believe the junk-bond market has enjoyed a false tranquility for the past 30 years.
Fridson, whom Institutional Investor calls “the dean of high-yield-bond analysts,” was combing through price data with his researchers, Kai Zhao and Yaxian Li. They were studying the magnitude of price movements in government bonds, investment-grade corporate bonds, and high-yield bonds, from 1987 to 2017—and something stood out.
Price swings should fall along a normal distribution. But it turns out the bell curve in high-yield bonds is messed up.
UST closes beneath the Cycle Bottom resistance.
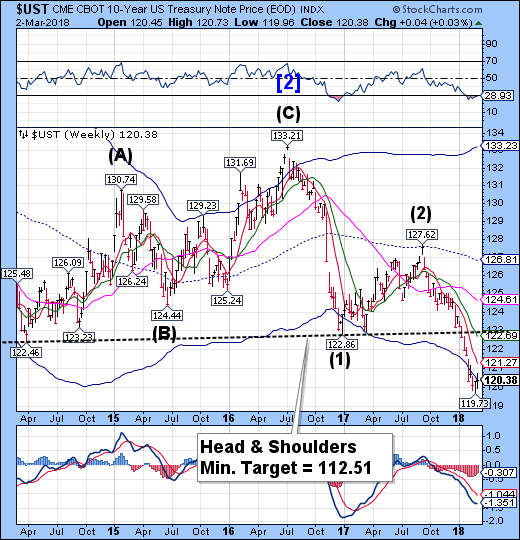
The 10-year Treasury Note Indexcontinued its bounce off the Master Cycle low, but may be running out of time to continue higher.The“normal” target for this bounce is usually a retest of the Head & Shoulders neckline near 122.75.However, the Model shows weakness that may turn into a rout for bonds within the next week, suggesting that Short-term resistance at 121.27 may prove fatal to the rally.
(WSJ) Investors sold Treasurys on Friday as anxiety about an international trade war percolated global markets.
The yield on the 10-year Treasury note rose to 2.855%, from 2.802% on Thursday. Yields rise as bond prices fall.
Bond and stock prices remained volatile Friday as investors grappled with new uncertainty regarding trade policy. President Donald Trump’s pledge to impose tariffs on steel and aluminum imports was met with threats and angry responses from U.S. allies around the world.
The Euro tests the rising trendline.
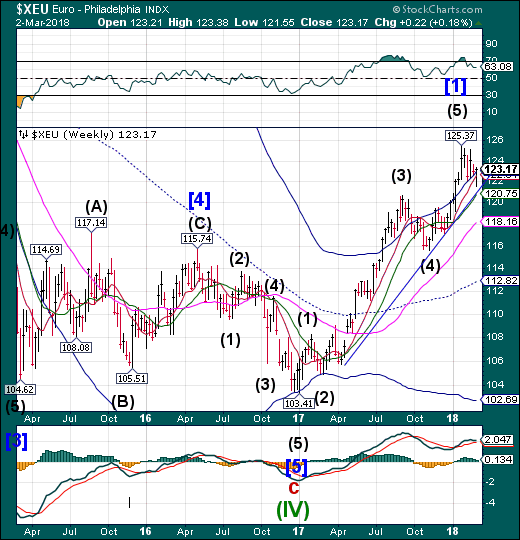
The Eurotested the rising trendline then bounced back above its Cycle Top at 122.94. A violation of the trendline may issue a sell signal for the Euro. The Cycle Model suggests abject weakness over the next two weeks, implying that the trendline may be broken sooner than later.
(Reuters) - Germany’s 10-year government bond yield hit a five-week low on Friday, as an Italian election and a milestone in German coalition politics this Sunday together with worries about a global trade war boosted demand for safe-haven debt.
Italian bond yields fell to a three-week low, pushing the gap over German peers to its tightest in two weeks and suggesting some confidence among investors heading into Sunday’s election.
U.S. President Donald Trump on Thursday announced plans for hefty tariffs on imported steel and aluminum to protect U.S. producers. That stoked concerns about a trade war, rattling stock markets and pushing U.S. and European bond yields down.
Euro Stoxx make a key reversal.
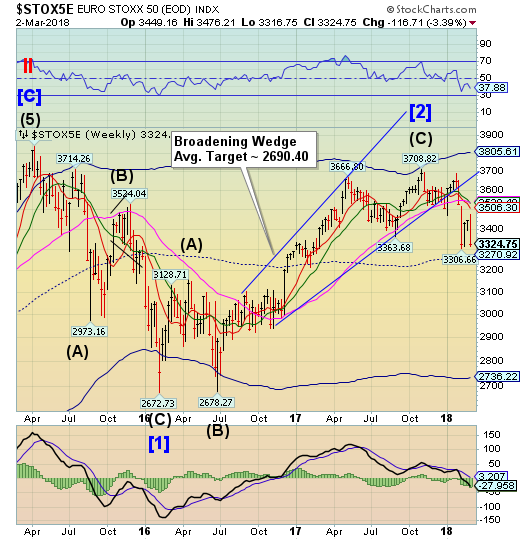
The Euro Stoxx 50 Indexmade a key reversal by rallying to a new weekly high, then declining and closing beneath the prior weekly low. European stocks remain on a sell signal.The Cycles Model suggests the decline may continue through the third week of March.
(BusinessInsider) A global stock market slide triggered by President Trump's tariff announcements on Thursday has spread into Europe on Friday morning, with all the continent's major bourses dropping substantially after the president said that "trade wars are good.
"When a country (USA) is losing many billions of dollars on trade with virtually every country it does business with, trade wars are good, and easy to win. Example, when we are down $100 billion with a certain country and they get cute, don't trade anymore-we win big. It's easy!," he tweeted.
On Thursday, Trump promised new tariffs — taxes on imports — of 25% for steel and 10% for aluminum. The president did not specify whether any countries would be exempt, but the restrictions are expected to be wide-ranging.
The Yen breaks through the neckline.
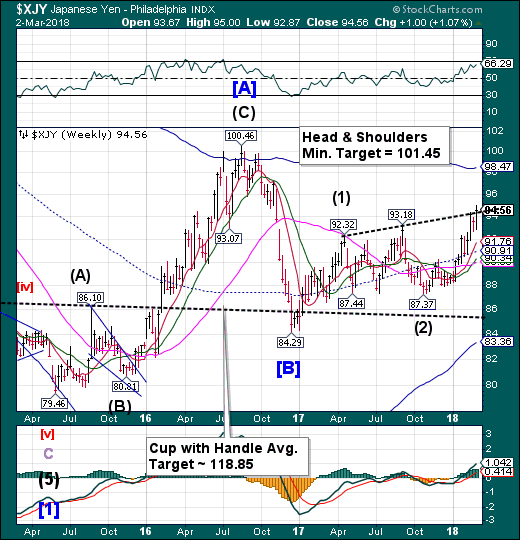
The Yen broke broke through the Head & Shoulders neckline, activating that chart formation.This solidifies the rising trend through early to mid-March. During that time, the Cycle Top resistance may be challenged.
(Bloomberg) President Donald Trump is touting the virtues of a trade war. In the $5.1 trillion-a-day currency market, the yen has emerged as a clear winner from the escalating rhetoric.
The latest move pushes forward the administration’s trade agenda, after it took similar actions on other goods this year and jawboned the dollar lower. The potential hit to U.S. and global growth from protectionism has sent stocks lower, initially drove bonds higher and buoyed the yen. Investors and strategists are wagering there’s more of the same to come.
The unfolding events remind Chris Turner, global head of currency strategy at IING Groep NV, of the early 1990s when the U.S. took protectionist steps against Japan.
Nikkei makes a weekly key reversal.
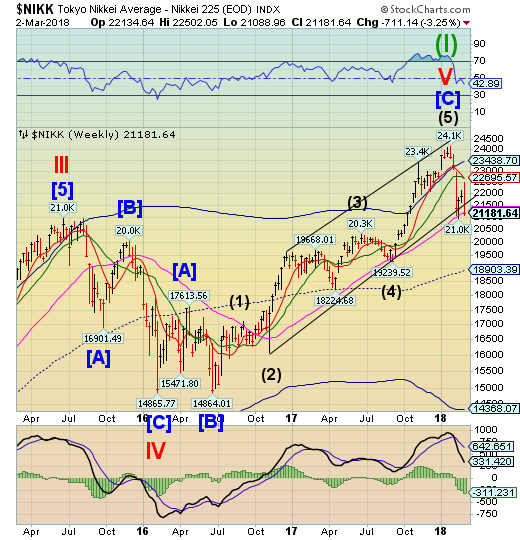
The Nikkei made a weekly Key Reversal by testing Short-and-Intermediate-term resistance at 22695.57, then dropping to test Long-term support at 21192.88.Cyclical strength appears to have disappeared with a major low may be due in the next week or two. The two-year trendline at 21750.00 has been violated and may be retested as the next decline is launched.
(Bloomberg) The Nikkei 225 Stock Average’s so-called death cross -- when the 25-day moving average drops below the 75-day moving average -- suggests that the market’s rebound from its 10 percent correction isn’t going to extend, according to Toshio Sumitani, chief market analyst at Tokai Tokyo Research Institute Co. in Tokyo. “The death cross is a bad signal for Japanese stocks,” indicating that investors may be ready to sell at lower levels following any rebound, he said.
U.S. Dollar falters
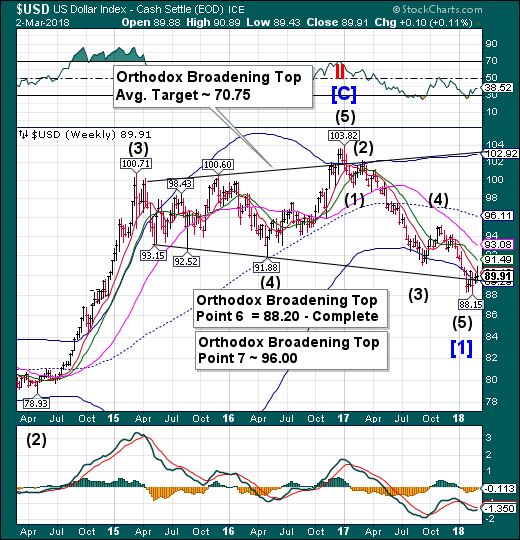
USDfaltered after rising above trendline and Cycle Bottom support at 89.29.TheCycles Model indicates a probable week of strength left in this rally. This suggests that the Broadening Top “Point 7” target near the weekly mid-Cycle resistance at 96.11 may be in question.
(Reuters) - The U.S. dollar could face headwinds if President Donald Trump’s proposals to impose stiff tariffs on steel and aluminium imports are enacted, with the biggest risk stemming from the possible flight of capital flows needed to finance ballooning U.S. deficits.
Currency markets, in general, dislike any form of trade intervention and previous protectionist efforts by the U.S. government have resulted in dollar weakness.
“The U.S. is now in a very precarious position because it’s putting a risk premium on U.S. assets by introducing tariffs and going down this protectionist route, which is negative for growth,” said Mark McCormick, head of North American FX strategy at TD Securities in Toronto.
.Gold bounces on Intermediate-term support.
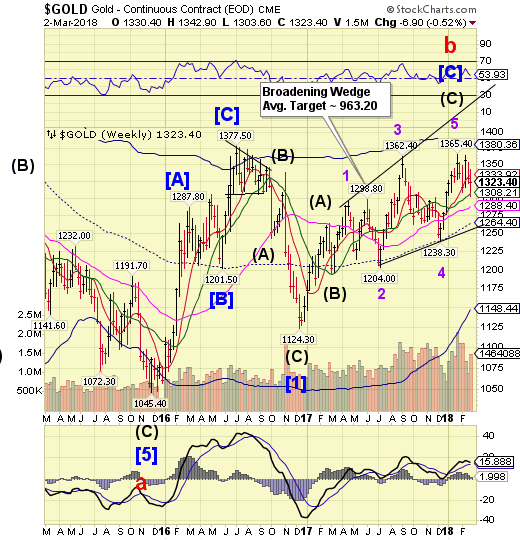
Gold bounced on Intermediate-term support at 1308.21 this week. The bounce may extend for another week, according to the Cycles Model.However, the upside may be limited, while a larger decline appears to be waiting soon after.
(Reuters) - Rising inflation has put gold back on the radar for investors looking to protect themselves from emerging price pressures, but history suggests its reputation has been overstated.
The experience of the last 50 years suggests gold performs better as a hedge against inflation shocks - like the spike caused by surging oil prices in the late 1970s and early 1980s - than the widely anticipated grind higher currently seen.
“If you strip out the 1970s, you find the relationship between gold and inflation is quite weak,” Brian Lucey, professor of international finance at Trinity College Dublin, said.“That is because you have a very different inflation regime in the late 1980s and 1990s than you had in the 1970s.”
Crude rebuffed at Cycle Top resistance.
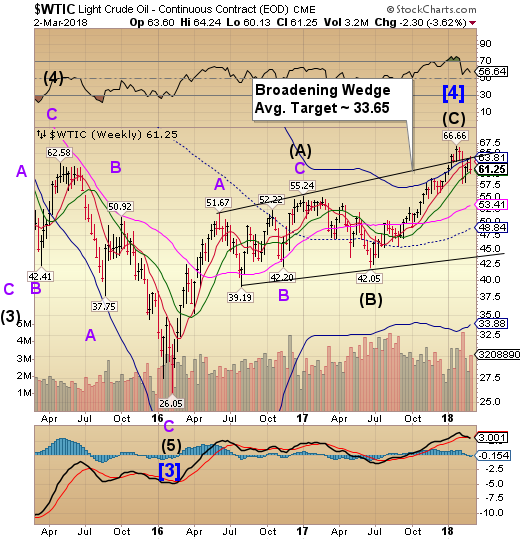
Crudechallenged its Broadening Wedge trendline and Cycle Top resistance at 63.81but was pushed back to Intermediate-term support at 60.62.The Cycles Model suggests some volatile swings in crude over the next week. A break of the Intermediate-term support, however, gives crude a sell signal.
(CNBC) U.S. oil production surged to an all-time high in November, topping the previous record set nearly half a century ago, government data showed on Wednesday.
The nation's drillers pumped 10.057 million barrels a day in November, the U.S. Energy Information Administration said in a monthly report. That edges out the previous record of 10.044 million barrels a day set in November 1970.
The record-setting output comes after a revision to last month's report showing November's output leaped to 10.038 million barrels a day.
Shanghai Composite may have broken critical supports.
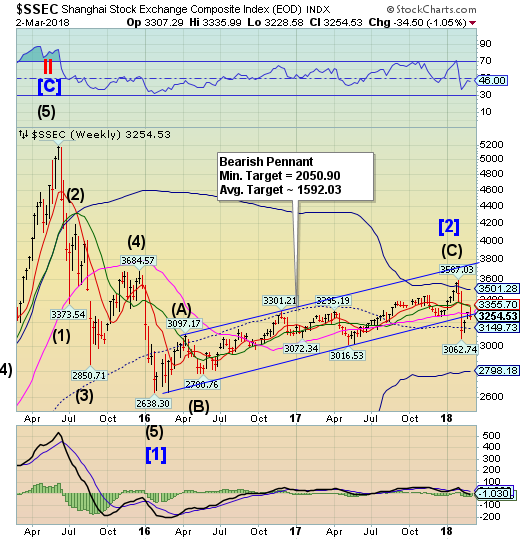
The Shanghai Index rallied Short-and-Intermediate-term resistance at 3344-3355.70, but was rejected.It has since declined beneath Long-term support at 3286.53 and the two-year trendline as well.This may set up the Shanghai to retest the February low and possibly the Cycle Bottom at 2798.18 in the coming weeks.
