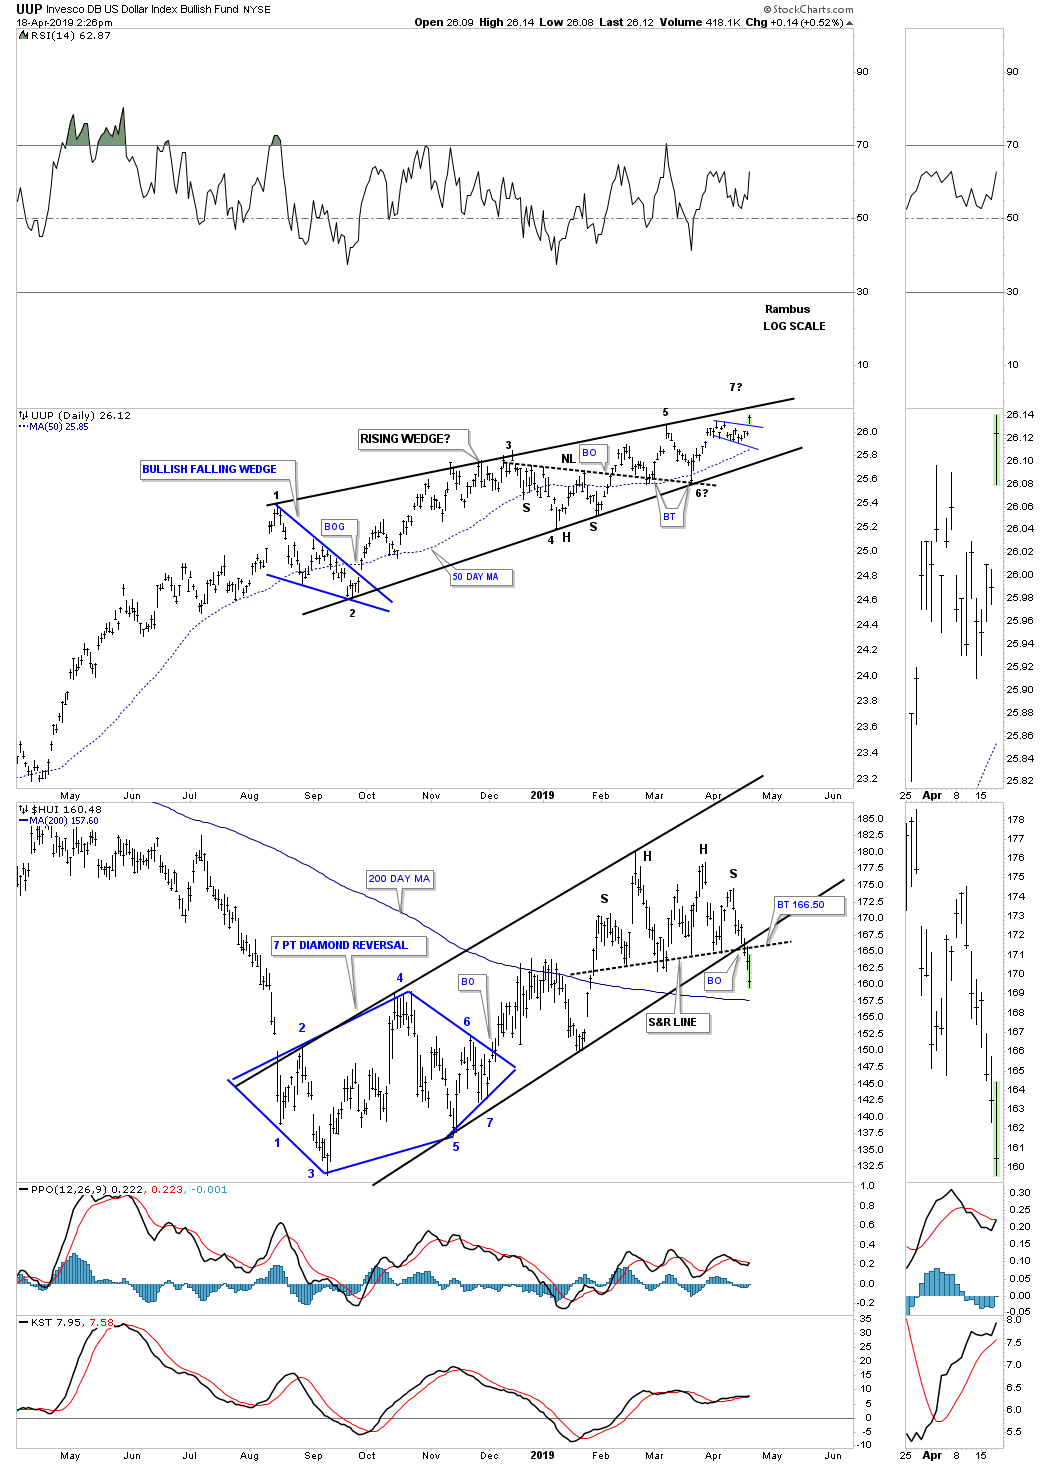
On Tuesday of this week I posted this combo chart showing the possible small blue flag forming on the PowerShares DB U.S. Dollar Bullish ETF (NYSE:UUP) (U.S. dollar). On Thursday, the price action gapped above the top rail and is now approaching the top rail of the rising wedge formation.
The sixth reversal point will be completed when the top rail is hit. This is where it starts to get interesting. Many investors believe the U.S. dollar is going to go down or collapse, which could be the case. On the other hand what if the U.S. dollar breaks out above the top rail of its August rising wedge?
Looking at the ARCA Gold Bugs Index, HUI, on the lower chart doesn’t give me a warm and fuzzy feeling right now. It’s not the prettiest topping pattern I’ve ever seen if indeed that is the case, but the price action over the last two days has broken the bottom rail of the uptrend channel and what I’m calling a S&R line. If you look at the price action above the S&R line you can see a double top with a left and right shoulder but no place to actually label a neckline, thus the S&R line.
In regards to a support and resistance line, above is bullish and below is bearish. How the price action interacts with the top rail on the UUP chart is going to give U.S. a major clue on what to expect next for the PM complex. If the top rail holds resistance then the PM complex should find support but if the UUP breaks out above the top rail of the AugU.S.t 2018 rising wedge then the PM complex will have a strong headwind to deal with. Now is not the time to be complacent.
