
The Commerce Department reported on Tuesday that the U.S. trade deficit, the dollar-value difference between American imports and exports, shrank 12.9 percent to $34.3 billion in November.
The figure beat analyst expectations of a deficit of $40.00 billion. The deficit figure from October was revised to $39.3 billion from the previously reported $40.6 billion.
Exports hit a record high, rising 0.9 percent, boosted by increased sales of oil. U.S. exports to China rose to a record 8.7 percent while exports to Germany and Japan also increased.
Meanwhie, imports fell 1.4 percent from October, amid reduced demand for foreign oil. Imports of industrial supplies and materials fell to their lowest levels in three years, while auto imports reached a record high.
Robust U.S. Energy Production
The rise in U.S. energy production played a substantial role in the strength of exports, with petroleum exports posting a record high in November. Petroleum purchases fell to their lowest level since 2010, impacting the level of imports.
In October of last year, U.S. crude oil production exceeded imports for the first time in nearly two decades. The U.S. Energy Department (EIA) reported this month that domestic oil production is rising to its highest levels since 1970 -- and is forecast to increase by an average of 800,000 barrels per day through 2016.
New technologies that have made previously inaccessible oil deposits within reach have played a major role in the recent energy boom.
U.S. Dollar
The U.S. dollar got a boost from the positive trade balance data and rallied to its highest levels in over a month. Investors will be watching closely this Friday, when the U.S. Employment Report will show if the improving job market was able to keep its momentum in December. Analysts expect the U.S. employment rate to remain at 7 percent, and that Nonfarm Payrolls will fall to 196K from the prior month's reading of 203K.
U.S. Dollar Index Daily Chart 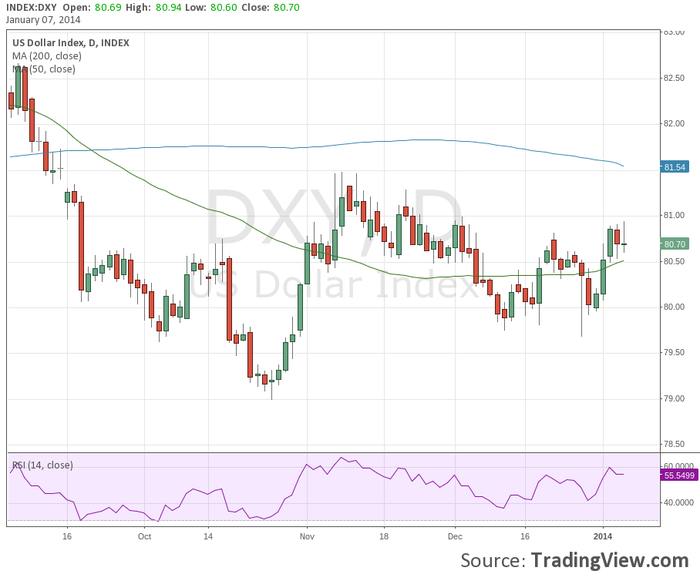
By Dan Blystone
- English (UK)
- English (India)
- English (Canada)
- English (Australia)
- English (South Africa)
- English (Philippines)
- English (Nigeria)
- Deutsch
- Español (España)
- Español (México)
- Français
- Italiano
- Nederlands
- Português (Portugal)
- Polski
- Português (Brasil)
- Русский
- Türkçe
- العربية
- Ελληνικά
- Svenska
- Suomi
- עברית
- 日本語
- 한국어
- 简体中文
- 繁體中文
- Bahasa Indonesia
- Bahasa Melayu
- ไทย
- Tiếng Việt
- हिंदी
US Trade Deficit Narrows To Lowest Level Since 2009
Published 01/07/2014, 01:10 PM
Updated 05/14/2017, 06:45 AM
US Trade Deficit Narrows To Lowest Level Since 2009
Latest comments
Loading next article…
Install Our App
Risk Disclosure: Trading in financial instruments and/or cryptocurrencies involves high risks including the risk of losing some, or all, of your investment amount, and may not be suitable for all investors. Prices of cryptocurrencies are extremely volatile and may be affected by external factors such as financial, regulatory or political events. Trading on margin increases the financial risks.
Before deciding to trade in financial instrument or cryptocurrencies you should be fully informed of the risks and costs associated with trading the financial markets, carefully consider your investment objectives, level of experience, and risk appetite, and seek professional advice where needed.
Fusion Media would like to remind you that the data contained in this website is not necessarily real-time nor accurate. The data and prices on the website are not necessarily provided by any market or exchange, but may be provided by market makers, and so prices may not be accurate and may differ from the actual price at any given market, meaning prices are indicative and not appropriate for trading purposes. Fusion Media and any provider of the data contained in this website will not accept liability for any loss or damage as a result of your trading, or your reliance on the information contained within this website.
It is prohibited to use, store, reproduce, display, modify, transmit or distribute the data contained in this website without the explicit prior written permission of Fusion Media and/or the data provider. All intellectual property rights are reserved by the providers and/or the exchange providing the data contained in this website.
Fusion Media may be compensated by the advertisers that appear on the website, based on your interaction with the advertisements or advertisers.
© 2007-2025 - Fusion Media Limited. All Rights Reserved.