Before we carry forward; I like to mention there is always a risk on going on multi pairs of the same cross. Hence; it is advisable to choose one of the two cross on the same pair for chances of one going wrong would indicate the other will be wrong as well.
So limit exposure; caution is advisable. For the day we have 2 set on the same crosses.
1… AUD/UD & EUR/AUD → Prefer AUD/USD Or Scale on both positions if both comes in and opting to go for both
2.. UJD/JPY & GBP/JPY → Prefer GBPJPY Or Scale on both positions if both comes in and opting to go for both
Trend Line Analysis: 17/07/2015
XAU/USD
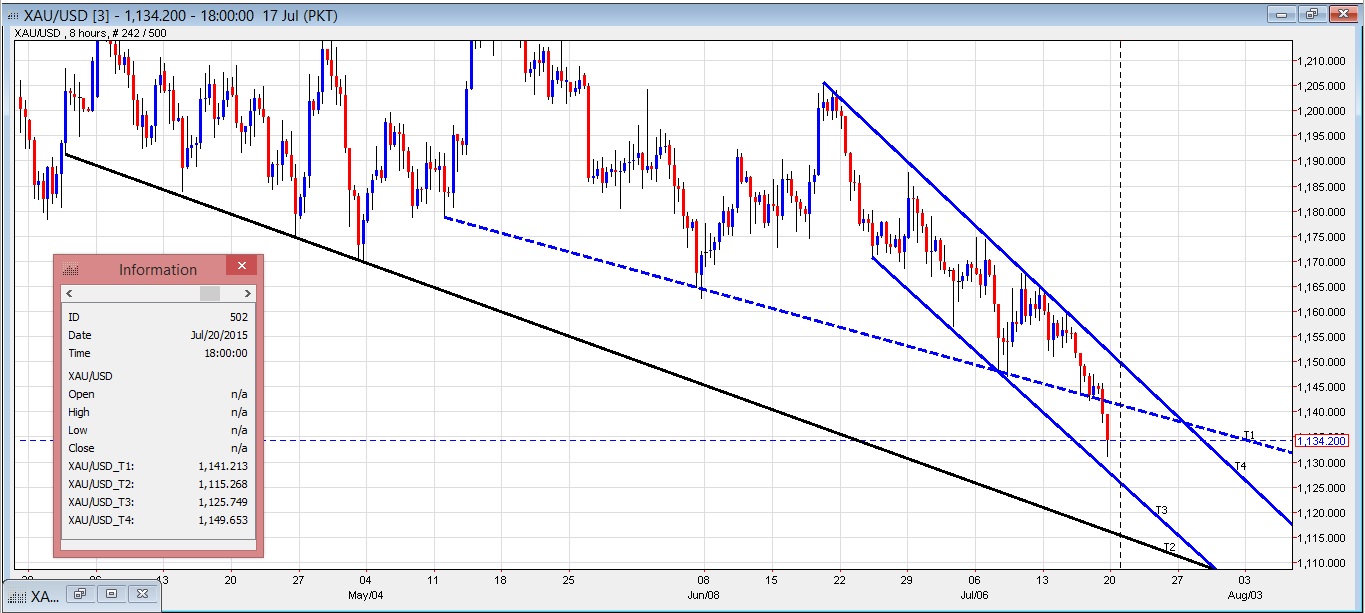
Shorts were triggered on break under 1441-42 and there was enough volume that helped the trade to progress rather nicely.
We can use any retrace back close to 1140-41 to reenter shorts for next leg down towards mid to lower 112X. Hence a retrace higher close to the level and a halt would indicate a genuine breakout in play and can set shorts for the optimum target down to mid 110X to 1110.
For further technical and a fundamental view please check Friday’s analytic report.
To carry it further; we are using 8 hr chart to illustrate our point of view. The very current price action is within the bear channel as can be seen within the blue trend lines. The dotted blue trend line had been the breakout within this channel prompting price to head lower towards the base to 112X. Prime target is the lower black trend line which is declining and just may line up to the weekly support towards 1105-06 in coming days considering any retraces to 1140-42 been contained.
To reiterate; 1140-42 prime level for entering shorts; with 1123-25 initial objective with prime lower to 1105-08.
USD/CAD
We have shorts trigger on Friday and with retraces shallow; there is a possibility of a re-attempt towards the resistance. With this in view we can use any movement towards 1.3000-3010 and a halt to enter shorts for a possible move lower towards 1.2820-3X.
To carry it forward and beside the Inverse H&S view I posted Friday; consider the massive brewing pattern on the Monthly. The layout suggests we will make it to 1.3500 handle and then can see a rather healthier pullbacks to put in a Bull Flag before a break and this takes leaps and bounds to the north side when that is does. Well that’s a view and can take considerable amount of time before it gets practical.
Nevertheless; the pattern dictates overall direction on the USDCAD is heading for a 1.3500 zone eventually and a break of the Daily resistance will / can set the course for that paly. Weaker fundamentals on CAD supports technical on the bigger move to come will be on the upper side.
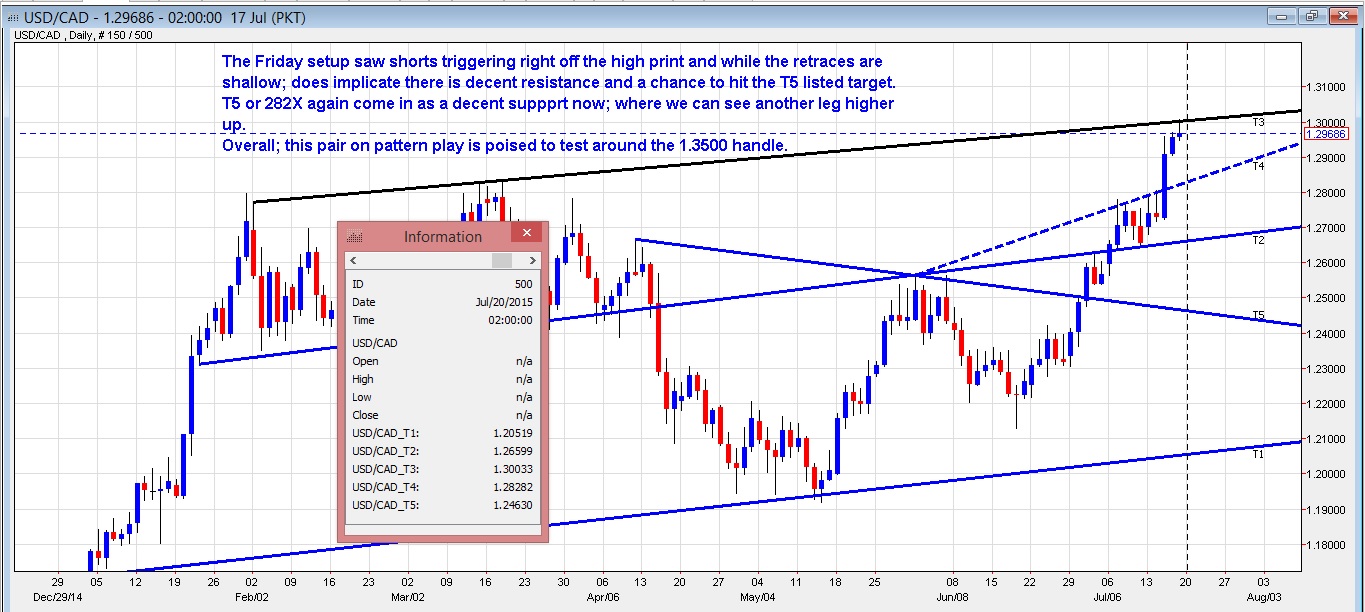
USD/CAD Daily – Upto 3010 still resistance with 282X support 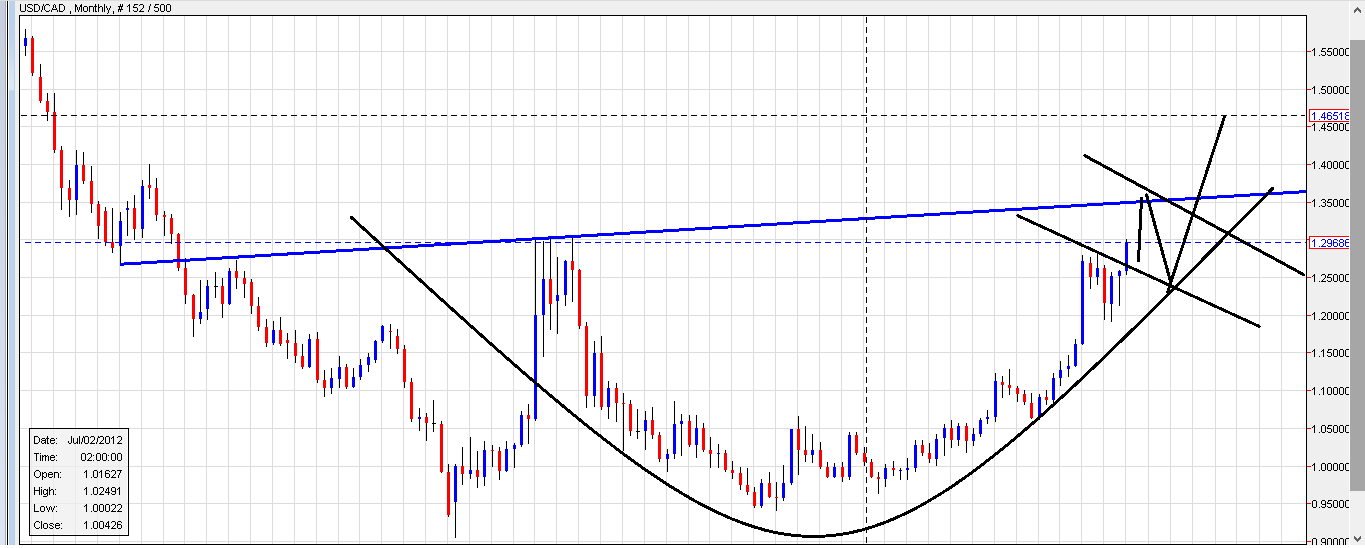
USDCAD Monthly – Massive looking Cup & Handle formation
EUR/AUD
We are interested to see a test closer to 1.4600 handle to go long on the pair with a moderate target to 1.4800 or closer. Overall would prefer a run back closer to 1.5100 handle if we can break and closer higher to 1.4800 listed resistance and channel top along with an ideal intraday target on the longs if coming into play.
Nothing much has changed from our view posted on the Friday; apart from EUR/USD breaking under 10865-70 cleanly and likely to stay on fragile grounds. 10805-10 is support on EUR/USD with main coming lower to 1071X. AUD/USD on the hand is not doing any better and if ends up breaking last week low has a speedy fall towards early 0.72XX as well.
EUR/USD weakness is contributed mainly to on-going Greece drama; and can actually find some solace provided 20th July payments due to creditors goes without much hindrance or hiccups. Regardless on the news event which either can provide much needed lift to Euro or cause panic selling EUR/AUD cross provides attractive opportunities around 1.4590-1.4600 handle.
Alternatively; a clean break and a close under to 1.4588-90 on 4 hr or 8 hr would signal more weakness on EURO and the pair EUR/AUD can slump close to 1.4300 handle.
To sun it up; 1.4600 with stretch to 1.4585 is support and if it holds; we can see a bounce higher with initial optimum north target coming to around 1.4800 for intraday targets with possibility of a break higher and a move back up to test the close to 5100 handle in coming days.
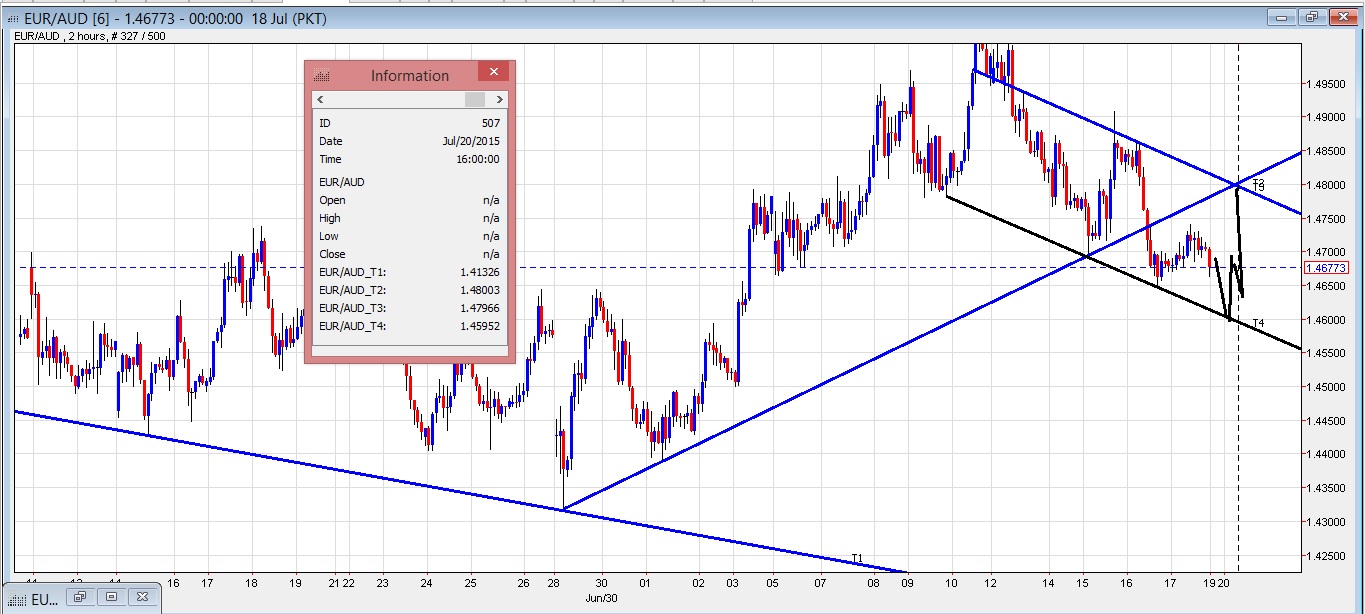
EUR/AUD 2 hrs- Intra Day Layout 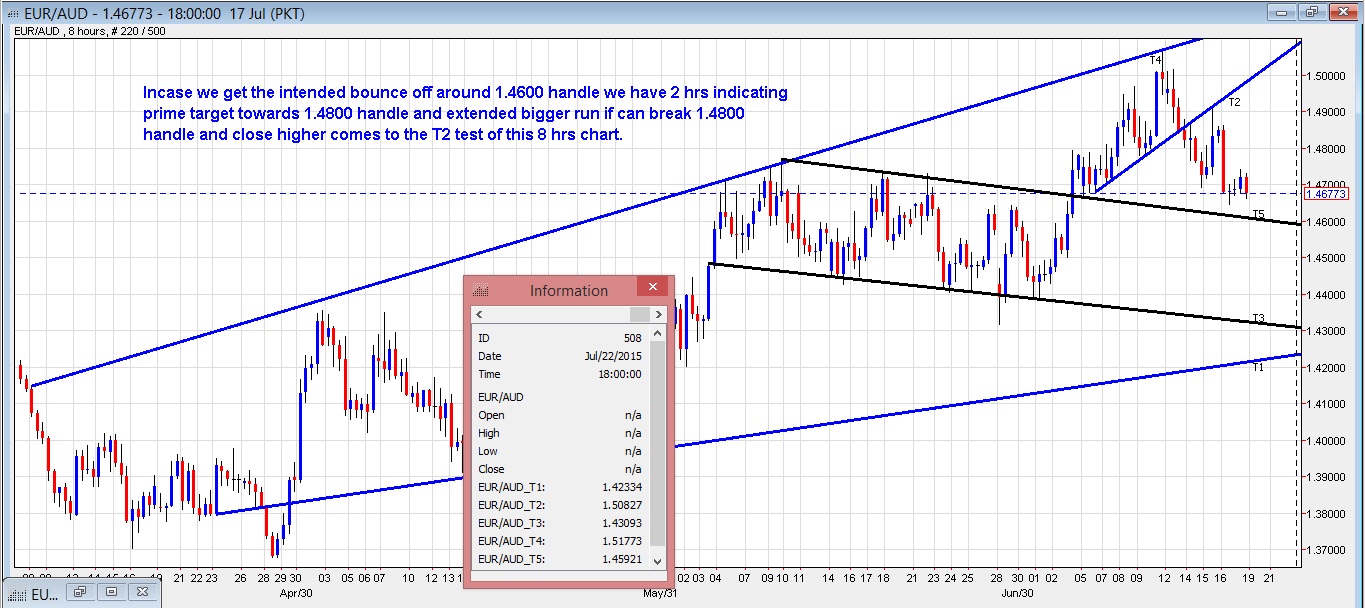
EUR/AUD 8 hrs – Bigger Picture
AUD/USD
The pair points to decent opportunities to set shorts up from 0.745X for a healthy risk to reward ratio. This level is coming up as a channel top on the main 8 hrs layout and if gets a test; interested to set shorts for a rundown to 0.7200 handle.
The pair has been in a constant downtrend after posting 0.8090 high and briefly finding support forming a base to 0.7600 handle which was short lived.
AUD/USD been a commodity currency has been hit hard by falling commodity and metal prices along with slowing down in China.
Add fuel to the fire with RBA cutting interest rate and RBA Governor Mr. Steven looking poise to cut further; while Fed Chairperson Yellen reiterating on course to hike the rates. Therefore, AUD/USD is to find itself on the defensive front and nail to the wall.
Technical picture also agrees with the fundamentals and it is all but a matter of time; before we see next round of selling on the pair.
To sum it up; while 0.745X offers best entry to go short; aggressive players will look for 0.7400-0.741X to enter shorts with an initial target of 0.732X. This later level comes in as a break point on Daily and main 8 hrs time frame which interests me. If we can attain a break and close under 0.7320 we will look for optimum target close to 0.7200 with initially 0.7260 to provide supp.
Alternatively; if this 0.7260 comes into play can look to long for a possible retrace to 0.732X.
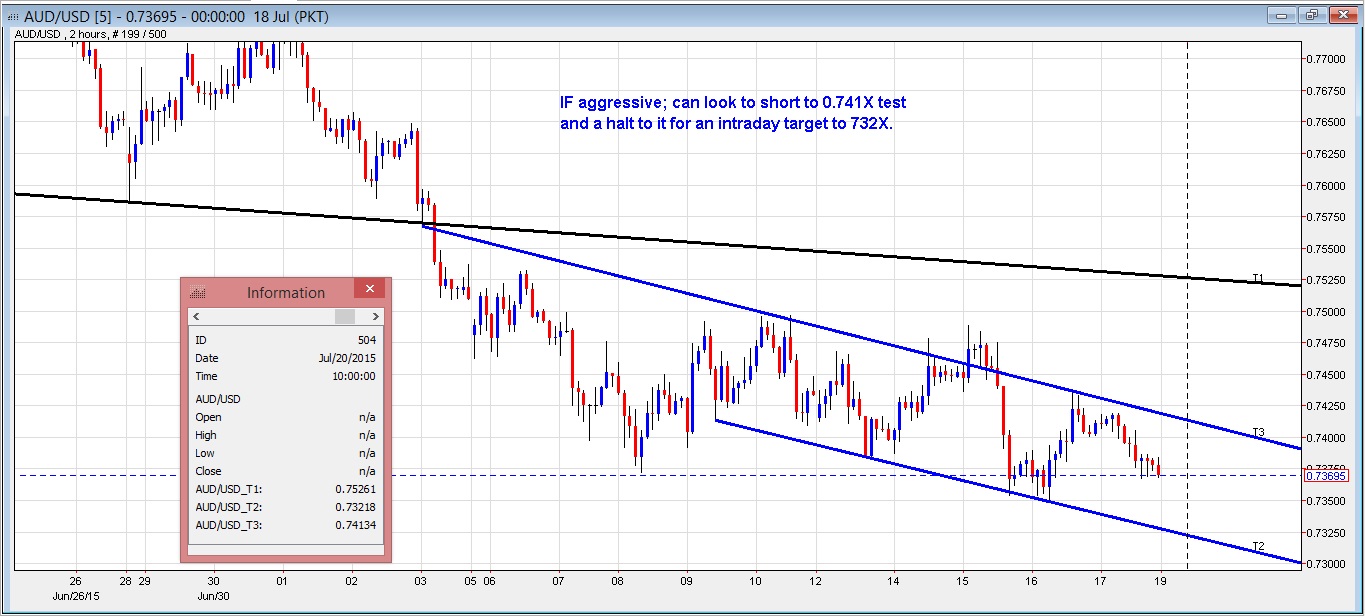
AUD/USD 2 hrs – Aggressive setup on shorts off 0.741X 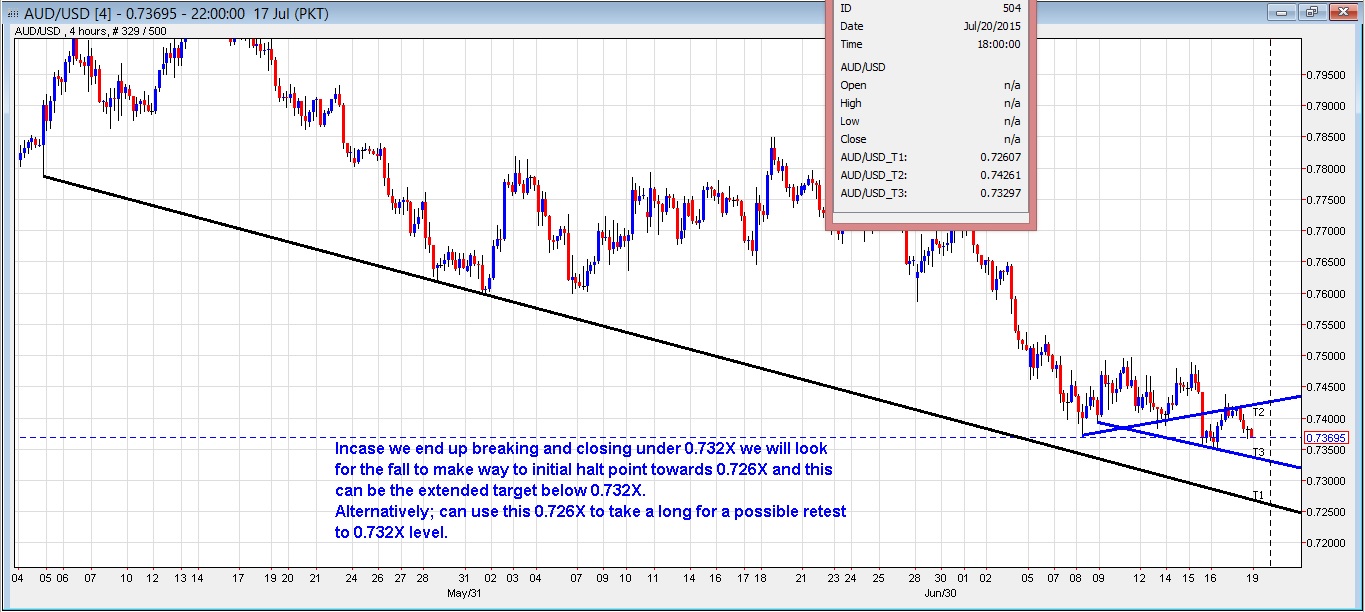
AUD/USD 4 hrs – 0.7260 zone as extended target on shorts 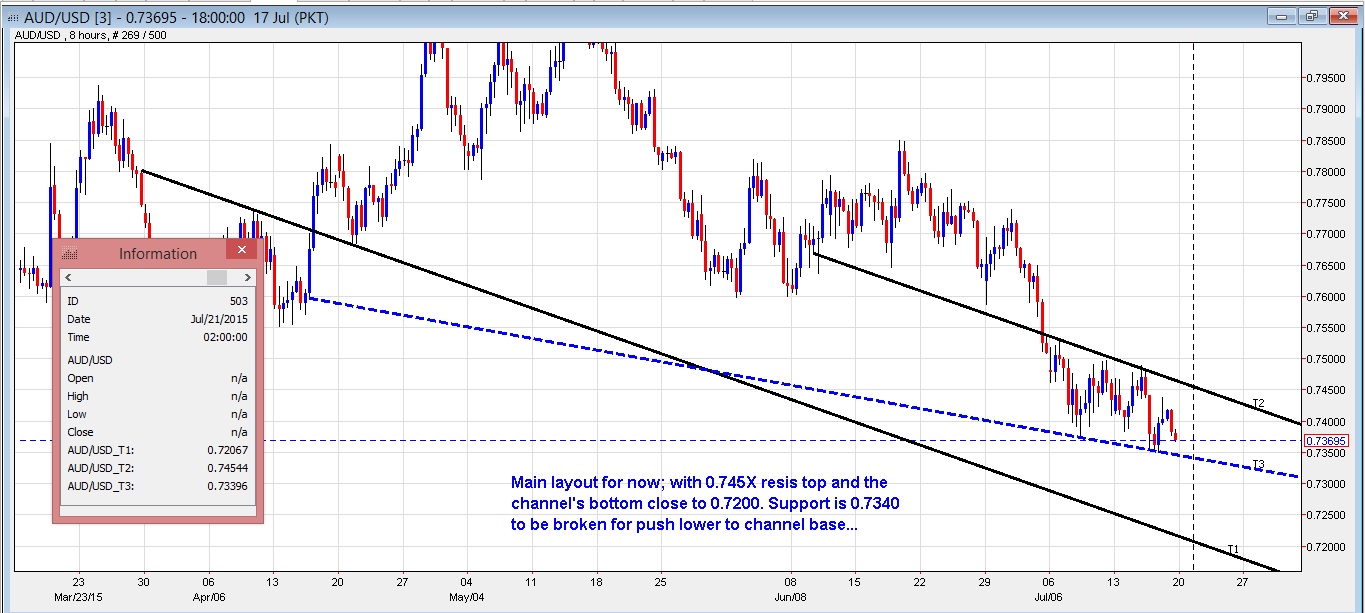
AUD/USD 8 hrs – Main layout 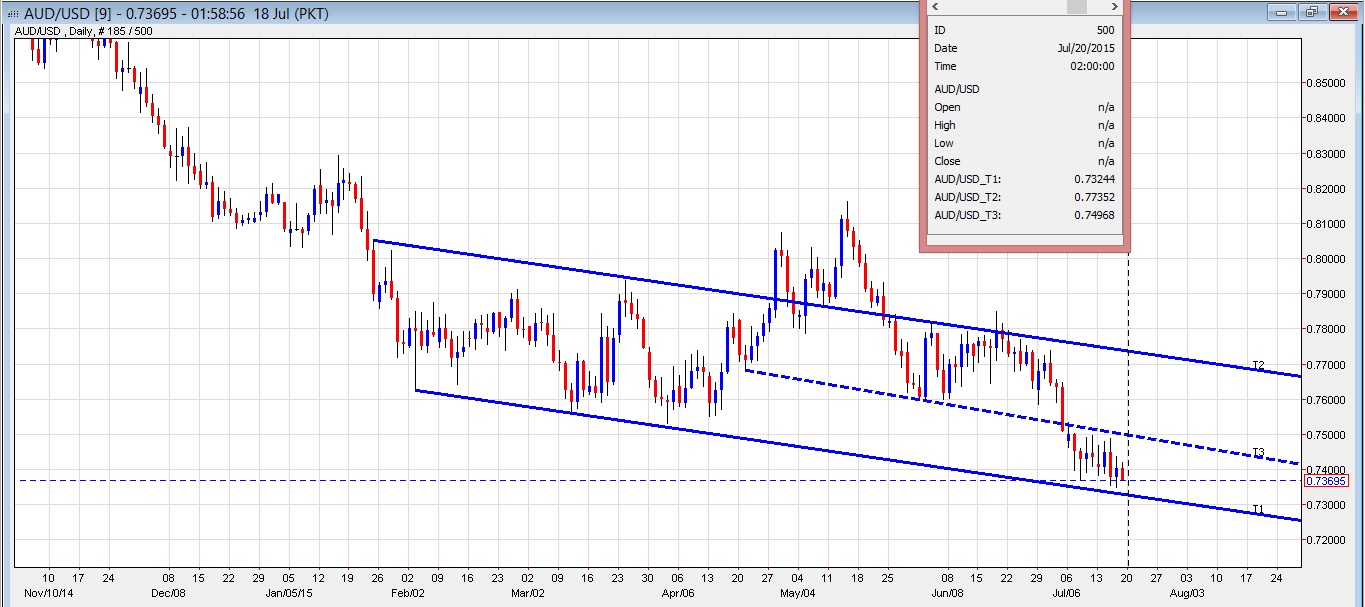
AUD/USD Daily – Pointing to 0.7320 as channel base
USD/JPY
We are bullish on the pair but looking for dips to get into longs. 123.40-50 comes in as a decent looking retrace to get in longs for a possible run higher towards 125.5X.
With Yen interest rate at all-time low while US is poise to hike rates; we are expecting significant move to the higher side on the pair on a bigger picture. Technical aspect of USD/JPY pins it higher as well. Beside the pattern that suggesting on long side to make its way to 125.5X with further potential grind higher towards 130 handle.
Hence; 123.4X retest and a halt suggests going long on the pair for an initial move towards late 124.55-60. 124.20 be the breakout point where upon testing 124.5X, the retraces can be contained to 124.20; we expect a break higher to 124.6X for a move building for a 125.5X.
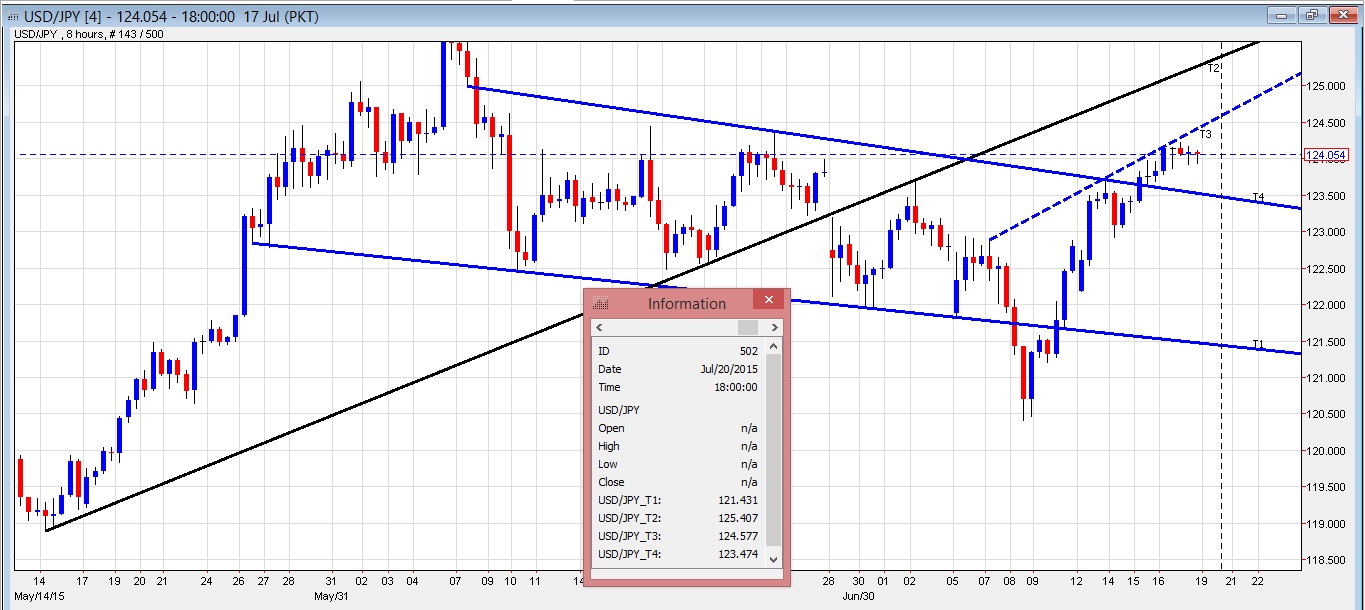
USD/JPY 8 hrs – Main Layout 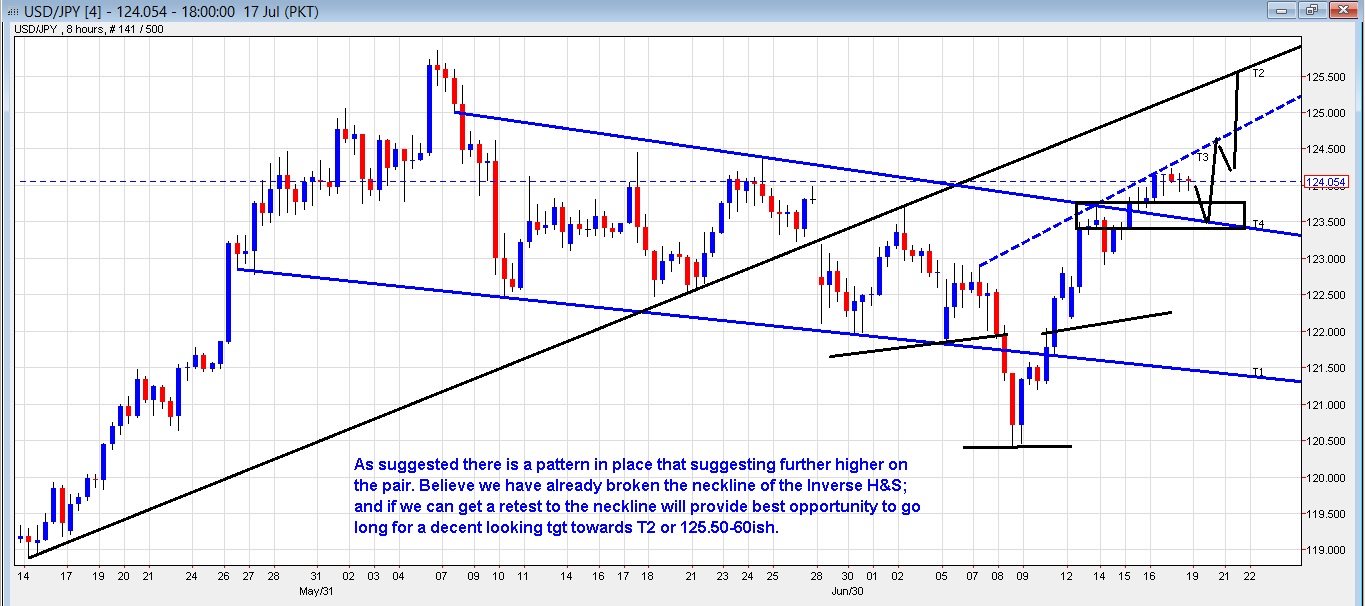
USD/JPY 8 hrs – We trading possibly higher to the Inv H&S neckline break 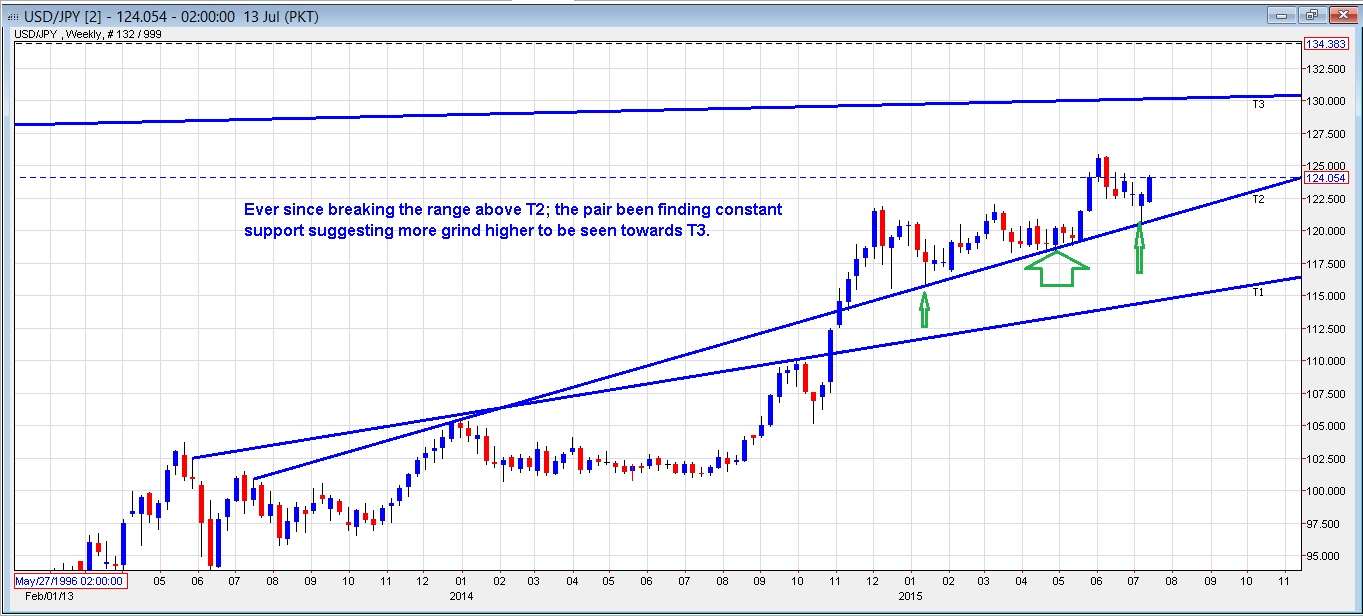
USD/JPY Weekly – Close Up view
GBP/JPY
Considering a pattern in play on the pair; we are ideally looking for a test of 192.40-50 and a halt to consider going longs for a possible move heading right into 196 handle.
One has to compliment this pair for the ferocity it carries even if it finds a short term trend. The fall from195.8X to 185 was a fast one. The pull back from the 185 to 194+ so far has been a furious one. To put the cherry on top; it took less than a month to do almost 2,000 pips swing. This fast and furious runner with wild swings definitely is not everyone’s cup of tea; but considering one can lay down a setup and act accordingly when conditions are optimum; the reward nevertheless is nothing less than breathtaking.
With USD/JPY looking to hit higher notes against the USD after little pullbacks and GBP/USD on the other showing resilient and coming in stronger against most of the crosses; this could be an ideal setup to have a small retrace on GBP/JPY for the new weekly candle and then carry the onslaught to the higher side.
Considering the swings it can perform and looking at the 4 hrs layout; a move towards 196.10-2X comes in as an ideal long position target and once done to it can consider shorting for a possible pull backs to 191.XX.
The 196.XX target comes in as the neckline of the bigger & better Inverse H&S it is depicting and as evident on most instances; the neckline on initial attempts usually holds out. The drop from 196.XX can then ideally put back the Right shoulder to either 191.XX or deeper towards 189.XX before clawing its way back up and ideally breaking the neckline and heading into 200.XX.
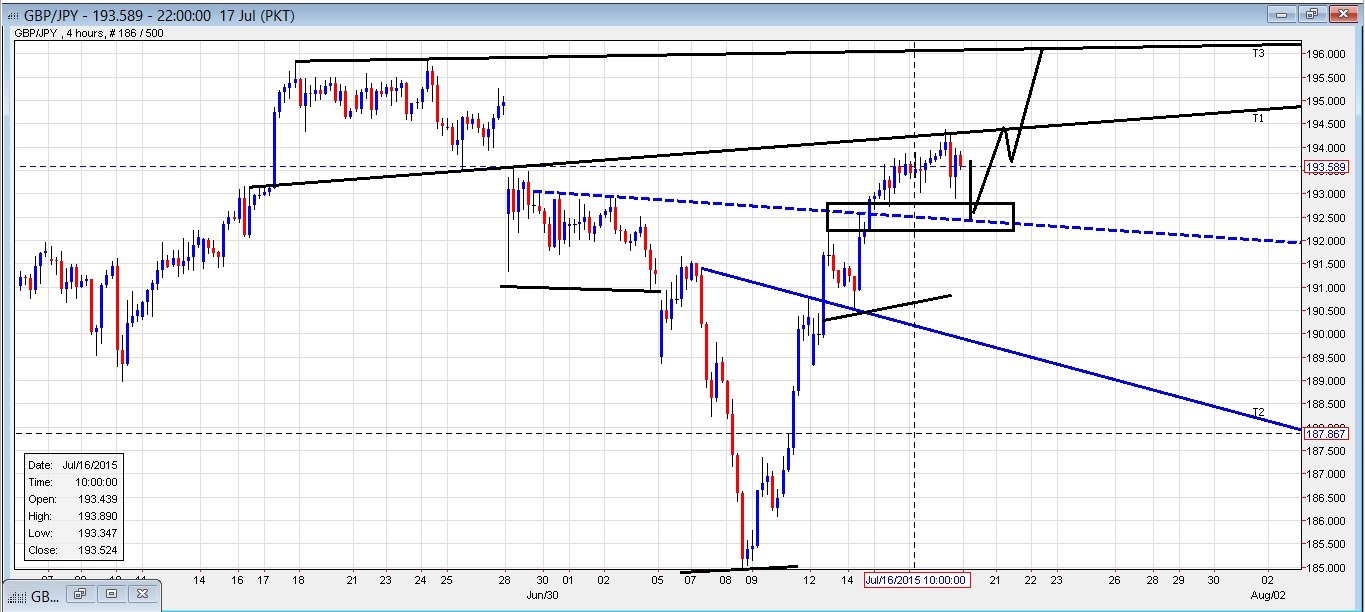
GBP/JPY 4 Hr. – Inverse H&S view with 196 target
Got any questions about our Trend Line Analysis? Contact us editor@littlefishfx.com
Disclaimer:
All comments, charts and analysis on this website are purely provided to demonstrate our own personal thoughts and views of the market and should in no way be treated as recommendations or advice. Please do not trade based solely on any information provided within this site, always do your own analysis. For more information please see our full disclaimer in the footer below.
