The whole idea of Trend Line Analysis is to capture the Price Action over the naked charts and find the most optimum zones for buy or sell. The trend line analysis done on the candle stick charts simply light the path for the price to travel.
We are looking for a move testing 1.1008-18 on the pair to go short for a possible revisit back to 1.0880 level with potential run to sub 1.0800.
EUR/USD has been idle past few days with a slow grind lower but the dogi close on the Monday with failure to close under the last swing low to 1.0824 on the daily was indicating a possible surge higher to come on the pair . The earlier fallout on the pair from 1.143X high was largely attributed to the Greece dilemma prompting two huge weekend gaps on the pairs earlier. While beside the dogi candle stick pattern the pair was heavily oversold and there was a need for a relief rally which finally came.
Though we believe the overall trend on the pair is still down with weekly showing a Bear Pennant, Daily showing Bear Flag ( the base of which comes to 1.0715-20 ); so any rally is likely to find willing buyers to get test to lower 1.07XX handle at least.
Hence we see 1.1010-22 in general as a breakout support to turn resistance and possibly a good rally point to set short on the pair. Initial target is 1.094X with potential run lower to sub 1.0800
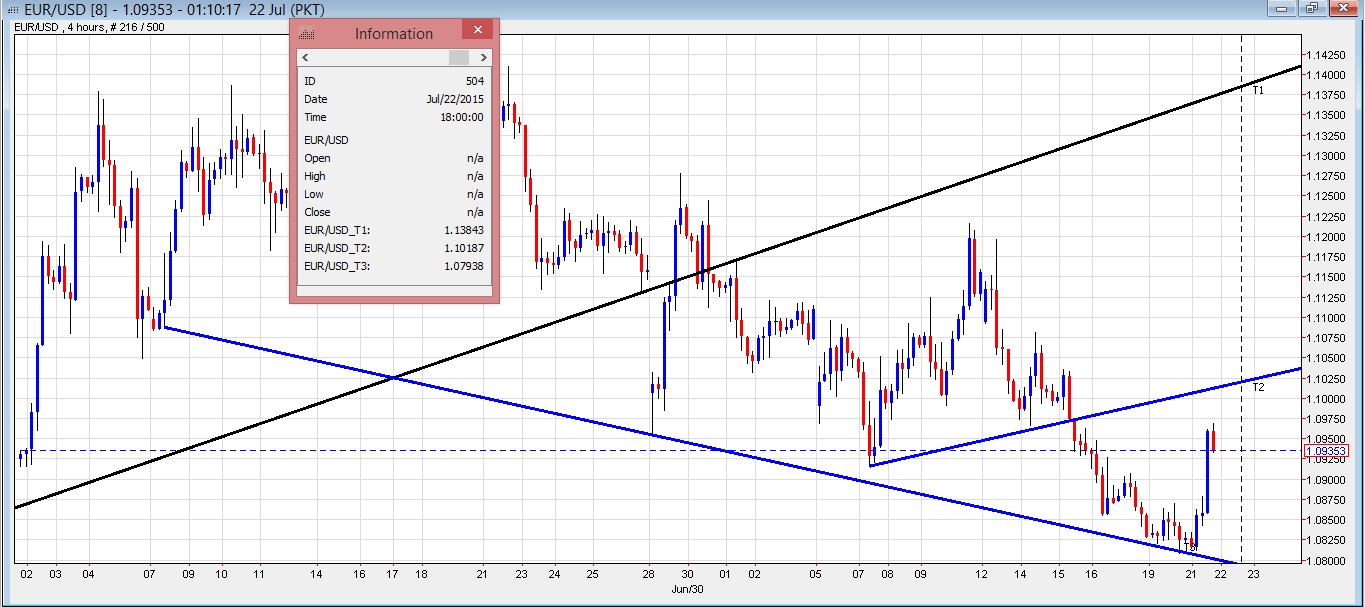
EUR 4 hrs – Main chart listed resistance to 1.1016-18 with hrly showing it a bit lower. Hence 1.1008-20 resistance zone.
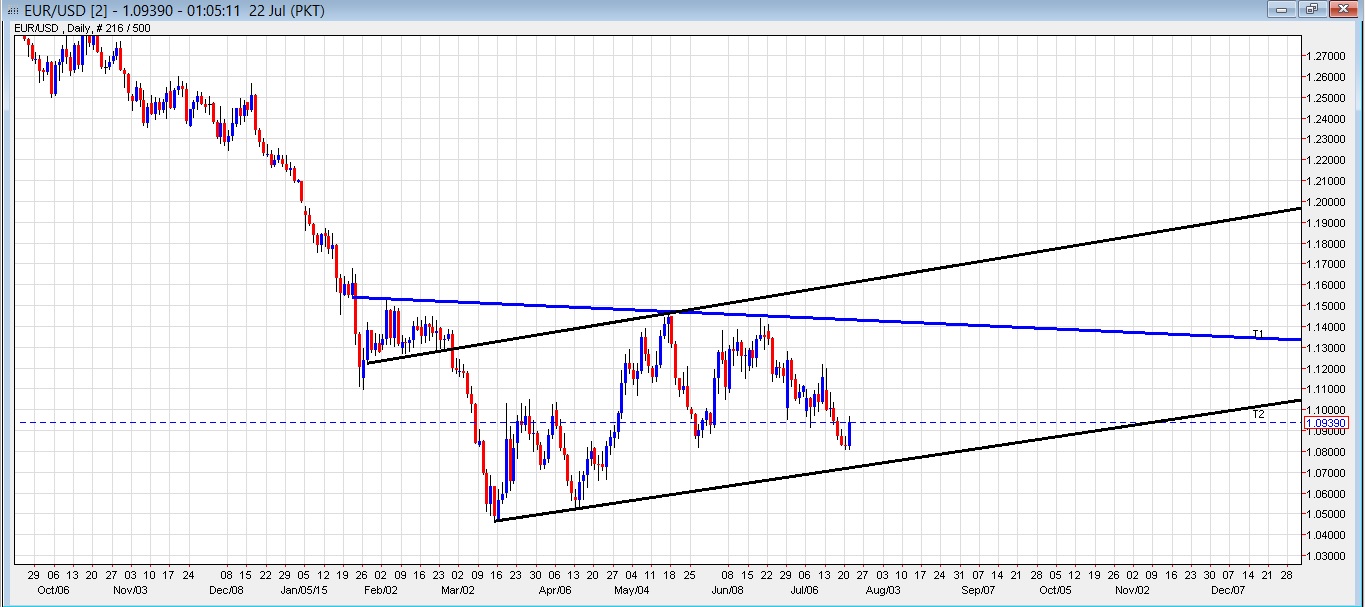 EUR Daily- Bear Flag view
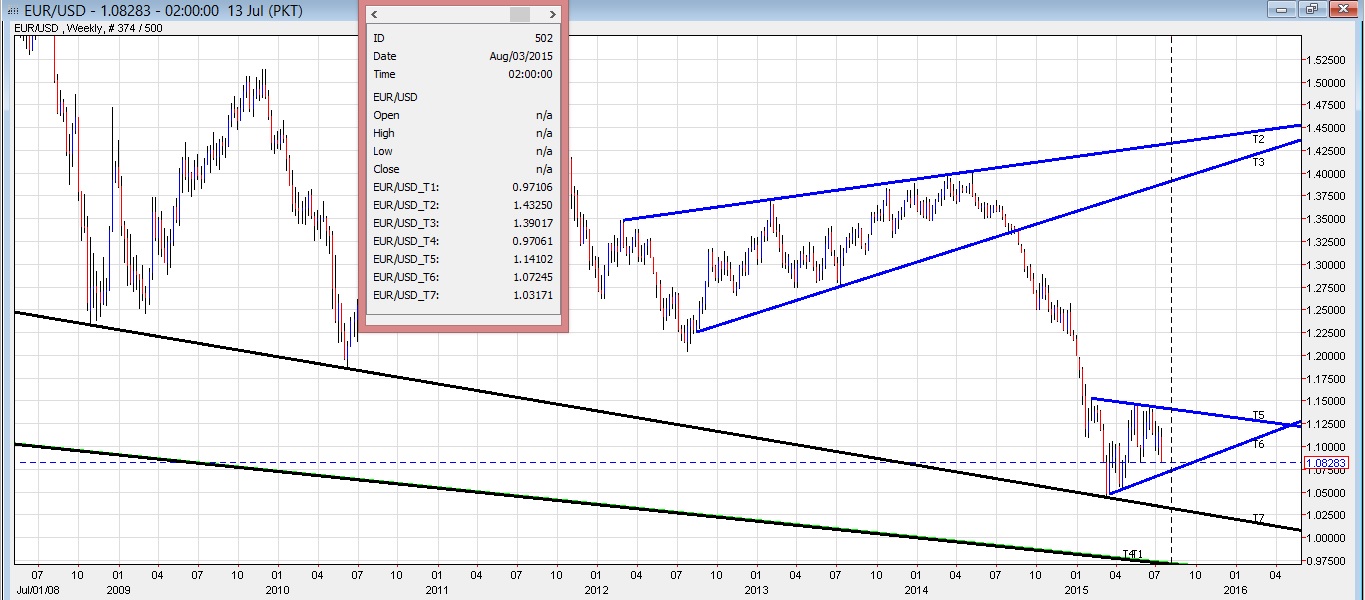 EUR - Bear Pennant a break points to 1.0300-15 target.
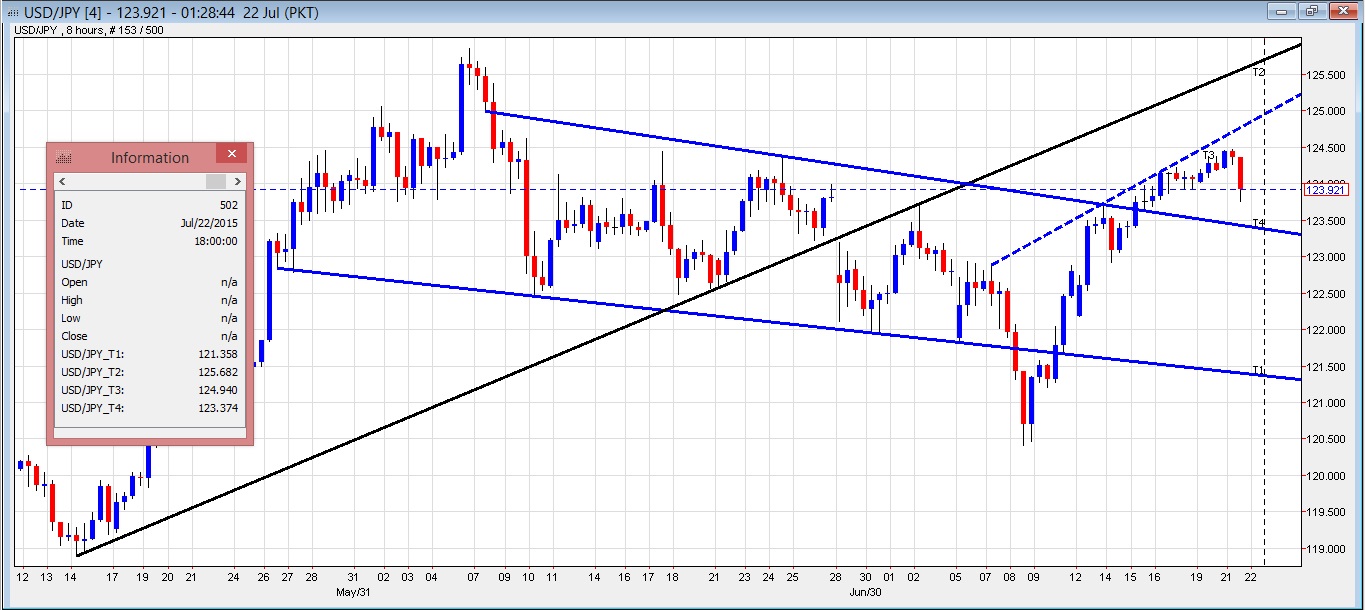
We are bullish on the pair but looking for dips to get into longs. 123.3X comes in as a decent looking retrace to get in longs for a possible run higher towards 125.5X.
For further details please check yesterday’s post on the USDJPY.
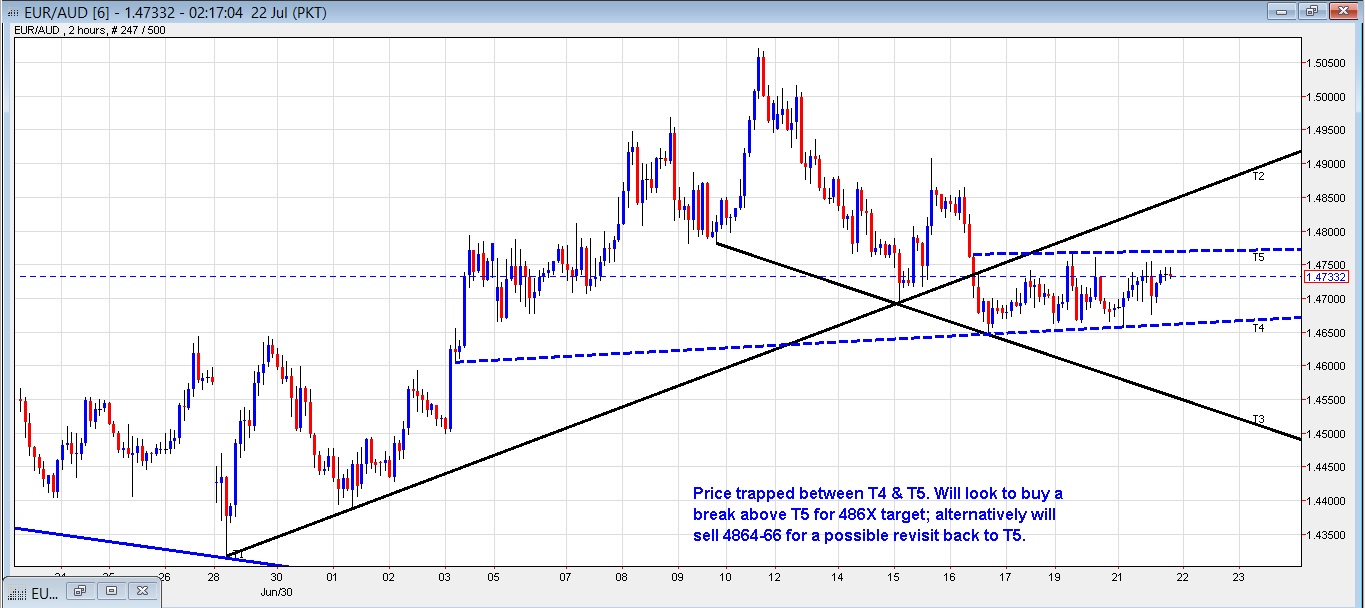
We are keeping things simple on this pair and interest to buy above T5 break or 1.4770 for a 1.486X target or sell under T4 break 1.4655-60 for a deeper drop lower towards early 1.45XX.
We been trying to buy this pair for past 2 days but it’s been slipping out. Where we are at the moment we are opting to go for the breakout strategy out of the dotted trend lines.
Our preference ideally is to see it breaking to the higher side and hitting 1.486X and alternatively we like to set shorts up from 1.4864-66 for a revisit back to the breakout point of T5.
Considering we have RBA Governor speaking earlier in the morning can expect volatility on the pair and such some caution is required. Any dovish comments specially hinting on further rate cuts can see 1.486X getting printed lightning fast. Hence it won’t be a bad idea to lower the position size while opting to short from 1.486X.
To sum it up; we like to play the breakout of either T5 for long or T4 to the lower side with alternatively trying to go short off 1.486X if comes into play.
We are interested in trying shorts on the pair around the 1.212 handle for decent retraces towards 2.105X with potential run to lower to 2.09XX.
The bigger picture on the pair calls for further rally as AUD recently saw rate cuts while BOE is hinting on rate hikes. The interest rate differential can pin the pair to the higher side and as such dips likely to be bought out.
At the present we are trying to go short off the recently broken support which is likely to act as a resistance atleast on the initial attempt and that is what we are trying to capitalize on.
Inshort; A test back to the listed support, now resistance to around 1.212 handle for the day can provide good risk to rewards opportunity on the short side.
