- All Instrument Types
- Indices
- Equities
- ETFs
- Funds
- Commodities
- Currencies
- Crypto
- Bonds
- Certificates
Please try another search

SPY Trends: Pullback Continues In Uptrend

Last week’s review of the macro market indicators suggested, as we closed the books on the September Options cycle and moved into Fall, that the equity markets were still strong but a bit tired. Elsewhere looked for Gold (SPDR Gold Trust (ARCA:GLD)) to continue lower along with Crude Oil (United States Oil Fund (NYSE:USO)). The US Dollar Index (PowerShares db USD Index Bullish (NYSE:UUP)) continued to look strong while US Treasuries (iShares Barclays 20+ Year Treasury (ARCA:TLT)) were bouncing in their downtrend. The Shanghai Composite (SSEC) was also strong and looked better to the upside while Emerging Markets (iShares MSCI Emerging Markets (ARCA:EEM)) were biased to the downside. Volatility (VIX) looked to remain subdued keeping the bias higher for the equity index ETF’s SPDR S&P 500 (ARCA:SPY), iShares Russell 2000 Index (ARCA:IWM) and PowerShares QQQ (NASDAQ:QQQ). The SPY and QQQ looked the strongest but on the weekly timeframe, with some cracks on the daily charts. The IWM looked weak in the short run and likely to continue towards the bottom if its consolidation zone.
The week played out with Gold holding up over the round number 1200 while Crude Oil bounced and started higher. The US Dollar Index continued its move higher and Treasuries extended their move up. The Shanghai Composite muddled along sideways until pressing higher late in the week while Emerging Markets continued their slide. Volatility popped higher, but remains at low levels. The Equity Index ETF’s started the week lower and made 1 month lows before a slight recovery Friday. What does this mean for the coming week? Lets look at some charts.
As always you can see details of individual charts and more on my StockTwits feed and on chartly.
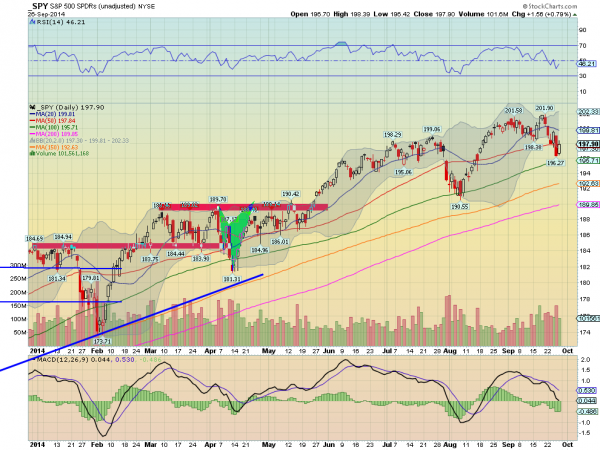
SPY Daily, SPY

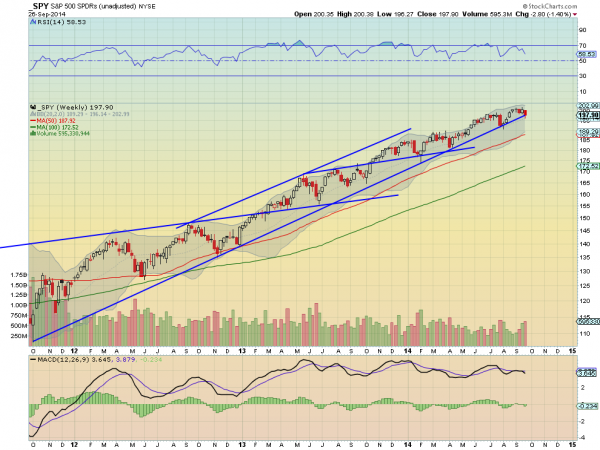
SPY Weekly, SPY

The SPY started the week lower, moving under the 20 day SMA. From there the 50 day SMA gave it a brief respite before heading back lower Thursday. Friday printed an inside day, or Harami, over the 100 day SMA. The RSI continues to trend lower with a MACD falling on the daily chart. These support more downside. The 100 day SMA below has been about where pullbacks have stopped the 2 years and will be in focus this coming week. The weekly chart shows a touch at rising trend support that has been in place since October 2011. The RSI is falling but in the bullish zone with a MACD that has crossed down and falling. More downside in store? There is support at 196.50 and 195 followed by 194 and 193. Resistance higher comes at 198.30 and 199 followed by 200 and 201.50 before 201.85. Pullback Continues in Uptrend.
Closing out the 3rd Quarter, the equity indexes are in retrench mode but without major damage yet. Elsewhere look for Gold to bounce around and possible rise in the downtrend while Crude Oil has a similar read with a reversal in the works, maybe. The US Dollar Index remains on fire, and maybe a little too hot in need of a rest while US Treasuries are moving higher. The Shanghai Composite remains strong and looks to go higher while Emerging Markets are biased to the downside. Volatility looks to remain subdued but with a risk higher keeping the bias higher for the equity index ETF’s SPY, IWM and QQQ. The indexes themselves are looking better to the downside in the short run, with the IWM near support and the QQQ strong on the longer scale with the SPY likely to see a bit more downside. Use this information as you prepare for the coming week and trad’em well.
Disclosure: The information in this blog post represents my own opinions and does not contain a recommendation for any particular security or investment. I or my affiliates may hold positions or other interests in securities mentioned in the Blog, please see my Disclaimer page for my full disclaimer.
Related Articles

Shares of Alibaba (NYSE:BABA) are on a tear to start off 2025. The consumer discretionary and tech stock is up by 52% this year as of the Feb. 25 close. The company’s cloud...

Every investor should know the term CEP, or customer engagement platform, because it is central to businesses' use of AI. CEPs provide software services to connect and communicate...

As markets try to look through the blizzard of policy changes flowing out of Washington, the crowd has shifted its preferences considerably in recent weeks based on a sector lens....
Are you sure you want to block %USER_NAME%?
By doing so, you and %USER_NAME% will not be able to see any of each other's Investing.com's posts.
%USER_NAME% was successfully added to your Block List
Since you’ve just unblocked this person, you must wait 48 hours before renewing the block.
I feel that this comment is:
Thank You!
Your report has been sent to our moderators for review


Add a Comment
We encourage you to use comments to engage with other users, share your perspective and ask questions of authors and each other. However, in order to maintain the high level of discourse we’ve all come to value and expect, please keep the following criteria in mind:
Enrich the conversation, don’t trash it.
Stay focused and on track. Only post material that’s relevant to the topic being discussed.
Be respectful. Even negative opinions can be framed positively and diplomatically. Avoid profanity, slander or personal attacks directed at an author or another user. Racism, sexism and other forms of discrimination will not be tolerated.
Perpetrators of spam or abuse will be deleted from the site and prohibited from future registration at Investing.com’s discretion.