Black Friday is Now! Don’t miss out on up to 60% OFF InvestingProCLAIM SALE

EUR/USD: USD Weakness Continues

Published 06/19/2014, 03:31 PM
Updated 07/09/2023, 06:31 AM
EUR/USD
-

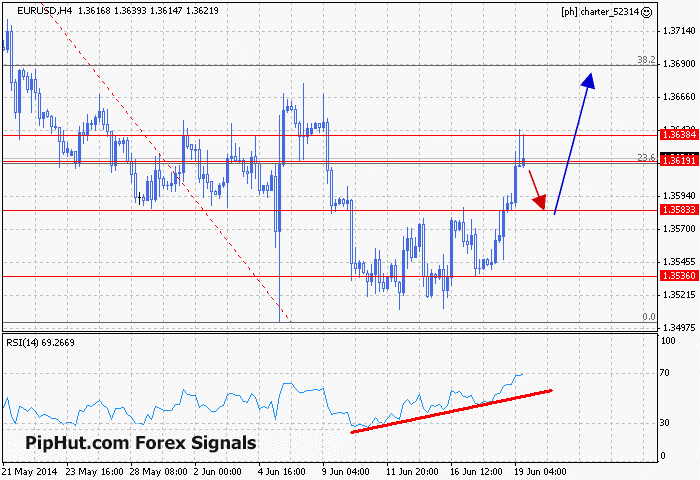
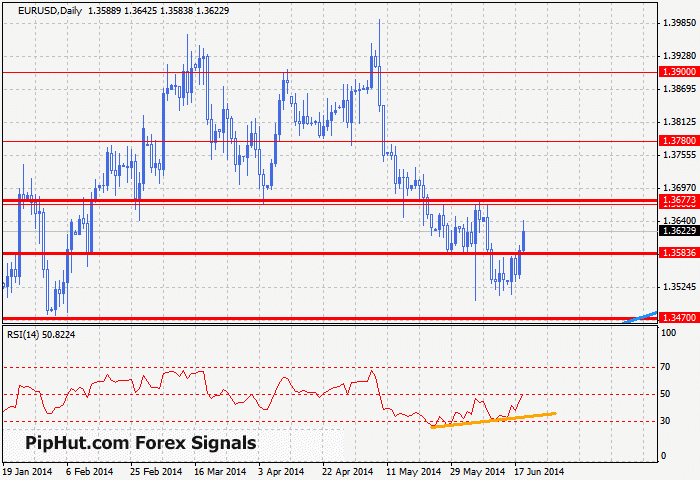
EUR/USD Daily Analysis: Our short-term target of 1.36 was hit this morning, getting as high as 1.3643 on continued USD weakness. It seems the post-FOMC analysis has focused on the fact that Yellen stressed a non-mechanical rise of interest rates after asset purchases cease. In other words, a retreat from the “6 months” Yellen offered last time and a “whenever we feel it is appropriate” stance. Ignoring the “you can leave when I say you can leave!” parental tone this strikes, short-term price technical analysis is flipping more bullish with a bullish RSI divergence on the daily chart (orange line on daily RSI), a bullish momentum reading on the 4h chart, with all of this being supported by a bullish rising support on the weekly chart (you can just see this on the daily chart, a light blue line in the bottom right).

EUR/USD H4 Chart

4h Chart

EUR/USD Daily Chart

Long-term Trend Analysis Chart

Our Preferred Trades*: Technically, there is a setup here for a short on the 4h charts as price just touches overbought around 1.3630, with a bearish shooting start last 4h candle. Bears have so far been unable to close below that shooting star, though, leaving the technical analysis mixed at best. As such we will pass on the short and look to get long with the short-term momentum on a dip to 1.3560-1.3600 with bullish candlestick confirmation, targeting a rally to 1.3670-1.3690 (the 38.2% retracement of the May drop).

Yesterday’s EUR/USD SwingPRO Signal Result: No setups triggered yesterday.

Today’s SwingPRO Signal: See preferred trade above.

*CandlePRO: CandlePRO can be used in conjunction with our daily analysis and “our preferred trades.” For example, if we prefer “going short” or “selling a rally” then we would look for bearish candlestick signals after a rally or near resistance levels. Alternative if we prefer “going long” or “buying a dip” then we would look for bullish candlestick signals on price drops or near support levels.
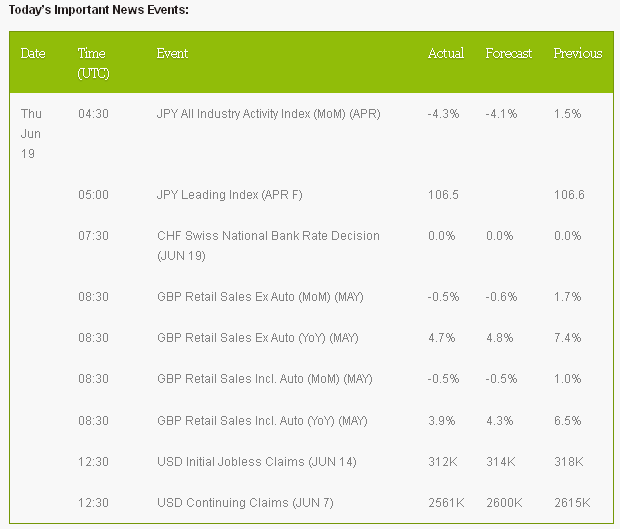
Important News Events

Latest comments

Loading next article…
Risk Disclosure: Trading in financial instruments and/or cryptocurrencies involves high risks including the risk of losing some, or all, of your investment amount, and may not be suitable for all investors. Prices of cryptocurrencies are extremely volatile and may be affected by external factors such as financial, regulatory or political events. Trading on margin increases the financial risks.
Before deciding to trade in financial instrument or cryptocurrencies you should be fully informed of the risks and costs associated with trading the financial markets, carefully consider your investment objectives, level of experience, and risk appetite, and seek professional advice where needed.
Fusion Media would like to remind you that the data contained in this website is not necessarily real-time nor accurate. The data and prices on the website are not necessarily provided by any market or exchange, but may be provided by market makers, and so prices may not be accurate and may differ from the actual price at any given market, meaning prices are indicative and not appropriate for trading purposes. Fusion Media and any provider of the data contained in this website will not accept liability for any loss or damage as a result of your trading, or your reliance on the information contained within this website.
It is prohibited to use, store, reproduce, display, modify, transmit or distribute the data contained in this website without the explicit prior written permission of Fusion Media and/or the data provider. All intellectual property rights are reserved by the providers and/or the exchange providing the data contained in this website.
Fusion Media may be compensated by the advertisers that appear on the website, based on your interaction with the advertisements or advertisers.
© 2007-2024 - Fusion Media Limited. All Rights Reserved.