Secure Trust Bank (LON:STBS) reported H119 adjusted pre-tax earnings up 14% yoy driven by volume growth and lower impairment rates. With a diversified lending model it has shown the ability to shift asset allocation significantly, de-risking and avoiding price pressures prevailing in some lending asset classes. By putting the brakes on early, STB is now reaping the rewards, with good profitability and the flexibility to adjust to macro and political changes.
Earnings on track
Although cautious on the macro and political environment, STB has pressed ahead in the segments where the price-risk proposition remained attractive. The loan book grew 24% y-o-y; retail point of sale (+32% y-o-y) and real estate business lending (still biased towards investment lending and with average LTV of 58%) were the main highlights. STB has completed the first stage of the transformation of its motor lending business and its auction stock lending platform is now live. The de-risking has compressed margins as expected (NIM fell from 7.3% a year ago to 6.5%) but this was offset by lower impairment charge rates and volume growth. The bank reported an adjusted £18.8m in pre-tax profits and an ROE of 12.8%. STB seems to be on track to meet our FY19 forecasts of PBT of £42m and ROE of 14.4%.
Healthy, flexible balance sheet
Although STB has used some of its capital for this growth, its CET1 of 12.8% still shows good headroom for a continued robust expansion rate. Liquidity remains good (loan to deposit ratio of 114bp) and we note that the launch of new cash ISA products in April was a success. The loan book duration is now only 1.9 years and this contributes to STB’s ability to profitably respond to changes in the macro and political outlook, particularly with Brexit looming ahead.
Valuation: Unchanged at 2,428p per share
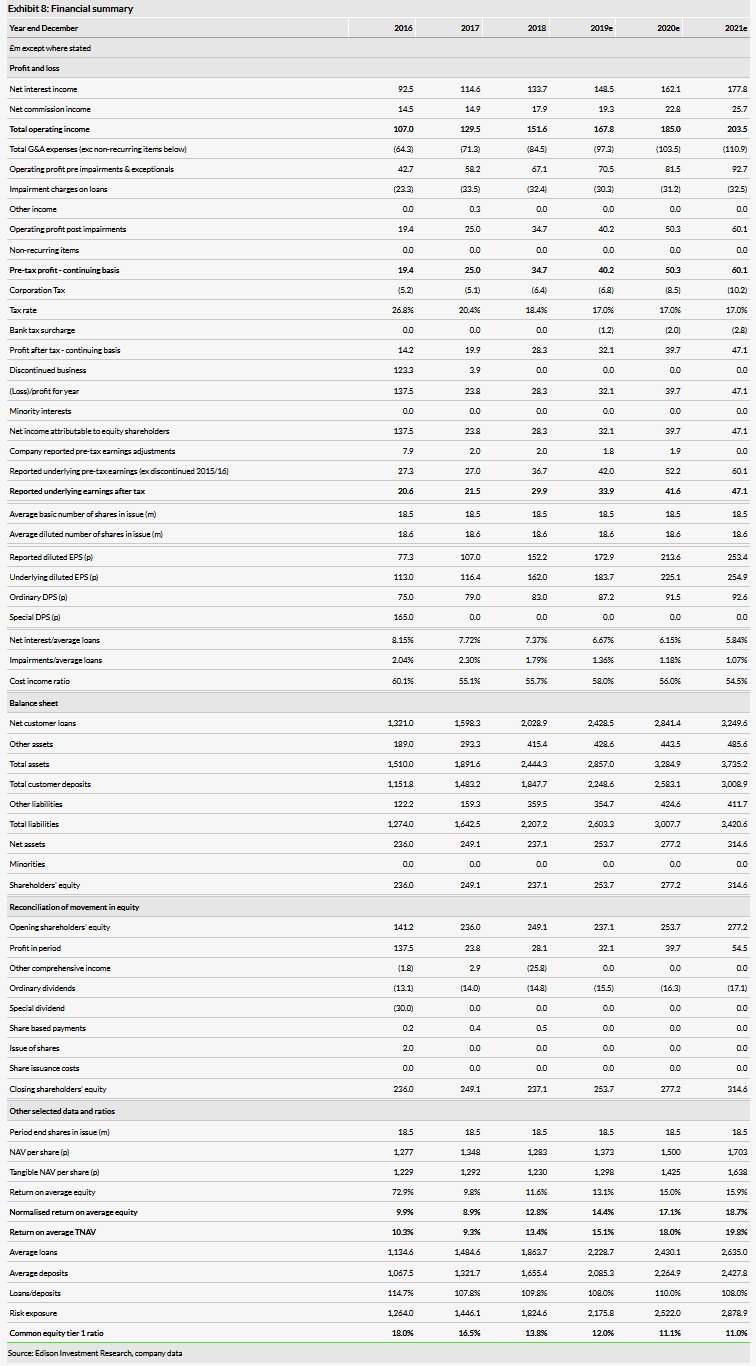
We have not made changes to our forecasts or our DDM-derived fair value (2,428p per share). We forecast STB to continue to deliver returns considerably above its 10% COE. We see ROE reaching 18.7% by 2021. As such, a significant premium to the current trading P/BV of 1.0x seems justified in our opinion. Our DDM fair value is equivalent to a 2019 P/NAV of 1.8x. STB is paying an attractive current year dividend yield of 6.6%, which is set to continue to grow.
Business description
Secure Trust Bank is a well-established specialist bank addressing niche markets within consumer and commercial banking. It is launching a non-standard mortgage business. Former parent Arbuthnot Banking Group’s shareholding is now less than 20%.
De-risking is delivering
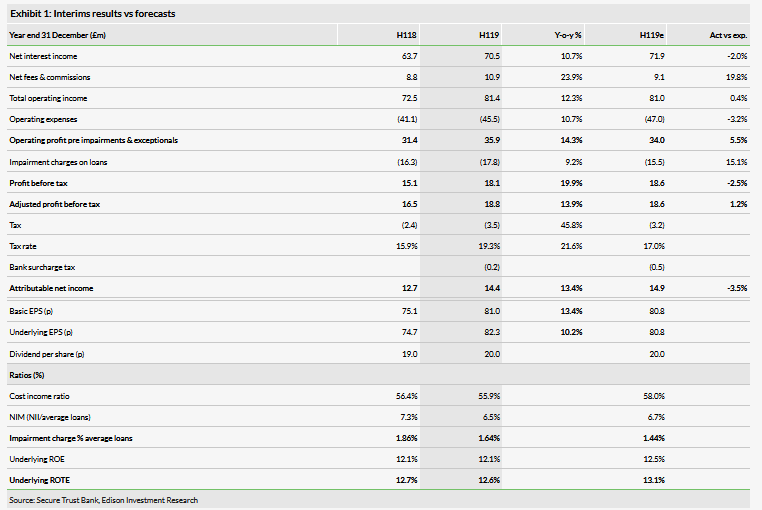
STB’s 2019 interims show the company maintaining its momentum while keeping a firm hand on risk. The reported pre-tax profits rose 20% y-o-y. Adjusted for one-offs it rose 14% to £18.8m, in line with our £18.6m forecast. The bank seems well on track to meet our £42m FY19 PBT forecast and we are leaving our estimates unchanged. The effective tax rate was higher this period and so the adjusted earnings grew only 10% y-o-y to £14.4m and the adjusted ROE was 12.5%.
STB’s diversified lending model and its willingness to reallocate capital proactively has allowed it to deliver on its de-risking strategy and side-step the price pressures in some lending asset classes. By putting the brakes on early, STB is now reaping the benefits, with good profitability and the flexibility to adjust to further macro and political changes.
The de-risking has resulted in the net interest margin (NIM) dropping from 7.3% a year ago to 6.5% in H119. Again, this was in line with our expectations at 6.7% (see Exhibit 1 below). The tighter NIM was offset by lower impairment charges as well as the volume growth. As a percentage of average net loans, impairments fell from 186bp in H118 to 164bp in H119. These were slightly higher than our forecast 144bp due to the motor finance division, which was affected by a 14% drop in used car prices during the period.
Despite balance sheet expansion, STB’s capital ratios allow for further robust growth (CET1 is 12.6%, already factoring future interim dividend payment). Liquidity is good as well and the loan to deposit ratio is 114%. The introduction of the new Cash ISA products in April this year has been successful. This is a relevant development since the Bank of England’s Term Funding Scheme (TFS) has been closed down since February 2018, and is now expected to wind down. STB’s drawings (total of £263m) mature in May 2021 and February 2022, and so good access to retail funding is very helpful.
STB also reported a relatively short average duration for its loan book at only 1.9 years. This reflects their lending mix including the increased retail point of sales lending. This enhances STB’s ability to respond to events in the coming months, and specifically to the type of Brexit that might occur. This has been a guiding concern for STB during the last couple of years and was reiterated in the management statements and reviews in the interim accounts.
H119 loan growth of 24% y-o-y
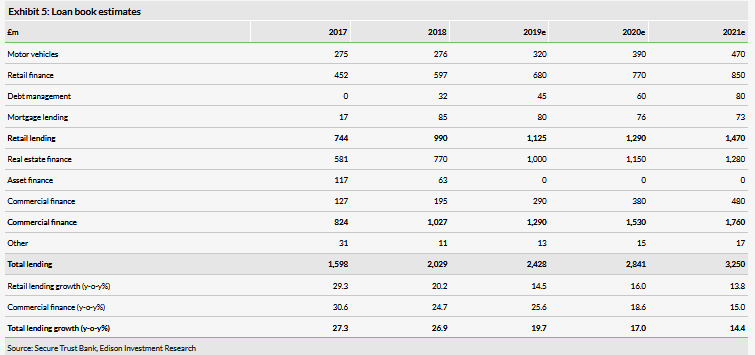
STB’s loan book increased 23.9% y-o-y during the first half of 2019, matching our expectations. There was no great surprise in the shape of the growth in the various segments. The book now stands roughly 50-50 between retail lending and commercial lending.
In the retail segment it is worth highlighting the particularly strong growth in the retail point of sale finance segment (+32.2% y-o-y). STB’s attraction to this segment is driven not only by its current asset quality (helped by low unemployment), but also by its short duration profile in the current context of macro and political uncertainty. All three of the largest sub-segments in this business (sports and leisure, furniture and jewellery) contributed to the strong growth. Growth was also boosted by the exit of a major competitor within the football season ticket sector in March 2019.
STB completed the first stage of its transformation programme in the motor finance division as part of its strategic shift from sub-prime to prime and near-prime lending. The first two stages involve creating dealer stocking finance and the next two a wider proposition for consumers. In this first phase STB has launched the V12 Vehicle Finance brand with auction stock funding in June 2019. This is being done in partnership with Aston Barclay, a leading UK vehicle auction house. This online platform allows short-term bridge finance (typically 60 days) to be quickly arranged in a one-stop solution.
Although the mortgage book did grow 204% y-o-y, new business in this segment has been temporarily paused by management since January due to concerns over price pressure and risk in this segment. Newsflow from several other competitors in recent months seems to have vindicated STB’s decision.
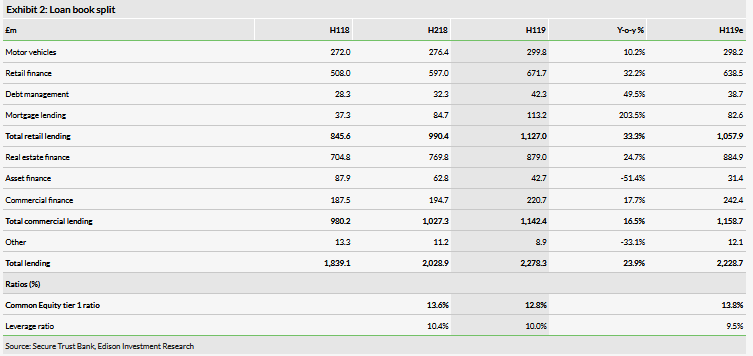
STB’s business finance segment also seems to be well on track to meet expectations. Real estate lending grew 25% y-o-y, with the bank maintaining its conservative stance on lending (average LTV 58%) and its bias towards investment lending. The asset finance segment continues to be run-off. The commercial finance segment (overdraft lending) grew 17.7%, benefiting from the geographic expansion of the business.
Improving asset quality
STB reported impairments of £17.8m (164bp of average loans), slightly higher than our forecast of £15.5m (144bp). The miss was driven by the £8m impairment in the motor finance division (we expected £4.7m; it was £4.9m in the second half of 2018). This was driven by used car values, which dropped by an unusually large amount (-14%) during the first half of 2019. The company reports that aside from this impact, underlying credit impairment trends were improving, reflecting the trends towards better-quality clients.
The retail point of sale lending is the other segment we expect to contribute most of STB’s impairments charges. Here the impairments were better than our forecast (£9.1m vs estimated £10.6m).
We do note that although there are some signs of slowdown in the economy, the current low interest rate and record low unemployment environment helps support asset quality. This of course could change, especially with a disorderly Brexit.
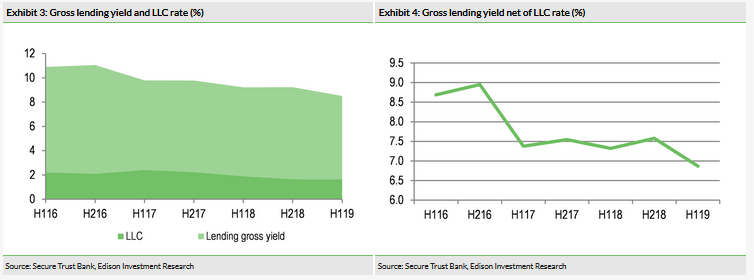
Exhibits 3 and 4 show STB’s lending yield and impairment rate progression. It is clear that there is some offset of the lower yields by the lower impairments, as would be expected. At the same time, we note that the lending yield net of loan loss charges (LLC) has been trending down. It fell from 7.6% in the second half of 2018 to 6.9% during the first six months of 2019. To some extent, this is the price of de-risking as well as current trading conditions. In our estimates, we expect to see another 30bp reduction – the gross yield contracting 50bp and the impairments improving by 20bp in 2020.
Outlook
We are keeping our forecasts unchanged after this set of numbers. We continue to expect STB to keep up a strong pace of balance sheet expansion: 20% loan growth in 2019, followed by 17% and 14.4% in 2020 and 2021, with both retail and commercial lending growing robustly.
No doubt macro and political uncertainty will probably continue to weigh on investor loan demand. Indeed, the Bank of England lending conditions survey earlier this year clearly showed these concerns and market expectations. So we do see some risk to our growth forecasts, especially if there is a disorderly Brexit as mentioned.
Assuming no dramatic adverse events, we believe that STB is well on track to meet our normalised ROE forecast for this year (14.4%) and we expect this to increase to 18.7% by 2021. The higher ROE will partially be achieved by greater usage of capital. We expect that by 2021, the bank’s CET1 will have dropped to 11%. This is an acceptable level of capital, but means that growth beyond 2021 will be funded by self-generated capital. STB’s reported adjusted pre-tax profit of £18.8m in H119 seems to indicate it is on track to meet our forecast (£42m underlying, £40m reported) for the full year. We are forecasting pre-tax earnings to grow 20% to £50m in 2020 and then to £60m in 2021.
We continue to expect to see gains in operating leverage as the bank grows and after the current investment cycle (eg motor lending transformation, geographic expansion in commercial finance). As such we forecast the cost to income ratio to come down to 56% in 2020 after the increase in 2019. We then expect this to decline further to 53% in 2021.
STB’s stance regarding selective acquisitions seems to be unchanged. The areas of interest are invoice finance, retail finance and motor. The bank also has the flexibility to step into opportunities created by non-bank lenders having difficulties in obtaining or renewing credit lines; an example of this was the season ticket lending in H119.
Valuation
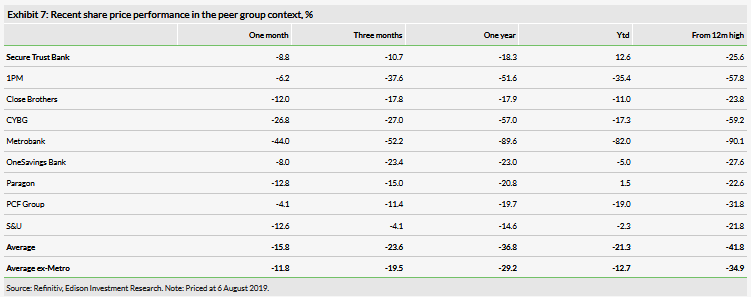
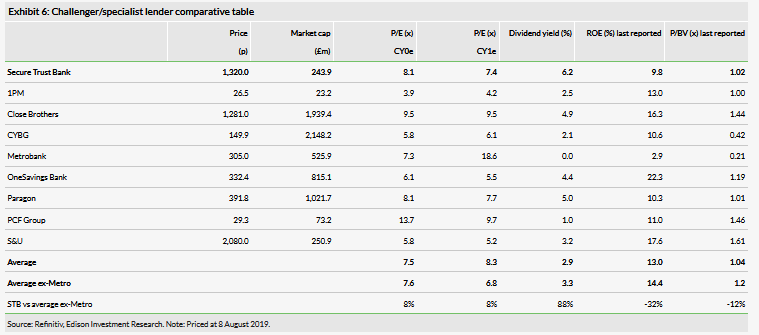
UK financial stocks have not been performing well in recent months. Even if we exclude struggling Metrobank, our sample of STB peers have on average dropped 13% ytd and 29% in the last 12 months. STB significantly outperformed the sector: it is up 13% ytd and only down 18% in last 12 months (Exhibit 7).
Despite this outperformance STB is still trading at relatively undemanding market multiples in our view. STB currently trades on a 2019 P/BV of only 1.0x, yet we forecast ROE of 14.4% already for this year and almost 19% by 2021. We also note that the peers in our sample have an average last reported ROE of (coincidentally) 14.4% and trade on a P/BV of 1.2x.
STB also trades at a 2019e P/E of 7.4x, which after its recent outperformance is now at a 7% premium to its peers. However, STB has a good prospective earnings growth profile and is delivering on its strategy. Furthermore, STB’s flexibility to adapt to both opportunities as well as adverse developments that could arise in the current uncertain macro and political environment is a big plus in our view. We also note that STB’s FY18 dividend yield of 6.2% is about twice as high as the average of its peers.
Ultimately, we use DDM and not market multiples to value STB. The FV has remained at 2,428p per share and this is equivalent to a 2019e P/NAV of 1.8x. The premium to NAV is justified by the forecast returns that are well above the COE of 10%.
