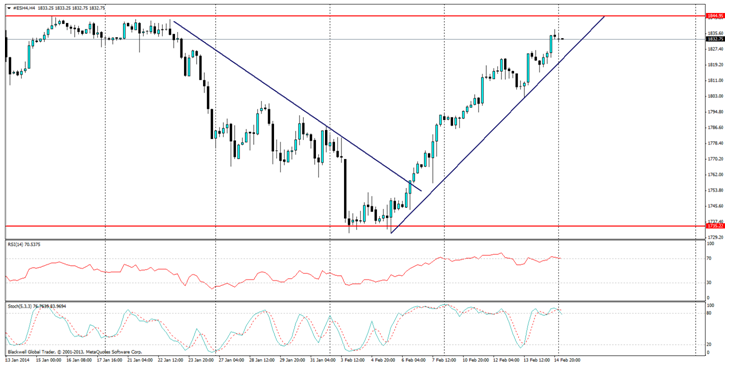
The S&P 500 has broken upwards as it looks to touch the ceiling it pushed off just a few weeks ago. What has led to this sudden turn around in the equity markets? Many are saying it’s just a minor correction but there is certainly more to it than that.
After a spate of bad data, the S&P 500 has started to gain more traction, as traders and the market now believe that Yellen will be put off reducing stimulus any further as US economic data has been relatively weak in the past week. Initial Jobless Claims were worse than expected coming in 9k higher than expected, while core retail sales were flat, with no gains. Then finally, on Friday night, we had industrialproduction, which came in at -0.3%, all around a bad batch of data from any trading standard.
This feeling towards a lack of tapering is led by the fact that many believe that Yellen is dovish in nature, and is a firm believer in tapering. Markets would certainly have gathered hope from her recent congressional meeting as she talked about sticking to Bernanke'spolicies, and keeping interest rates as low as possible for the foreseeable future – until the markets were in a good position.
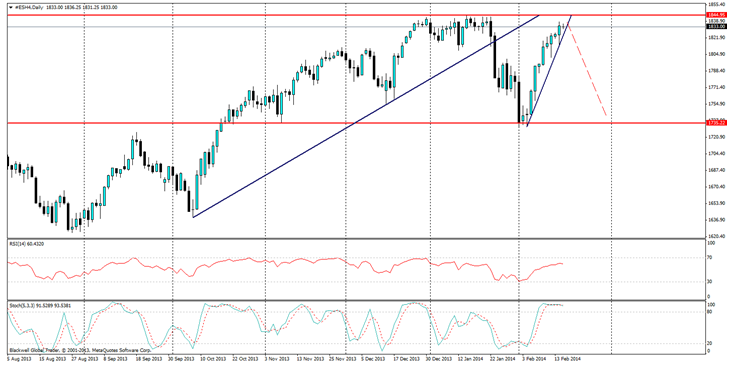
What does this mean for the S&P 500 though? Well, certain statements would seem bullish, but past results have seen the S&P turn negative as well. What is certain is that the S&P is moving towards a ceiling it has yet to break, and you can be sure traders will be looking to bounce off it.

The current level of 1845.00 is certainly the market to beat, but for weeks this was tested and no upward movement could be found. Nothing has really changed since then to signal it could go further, fundamentally and technically.
RSI levels are showing heavy buying pressure, as traders look to force it higher and higher as they look to push off those levels and force it back downwards. The current trend line should act as support, but any breakthrough could lead to heavy selling, especially if it has touched the 1845.00 mark.

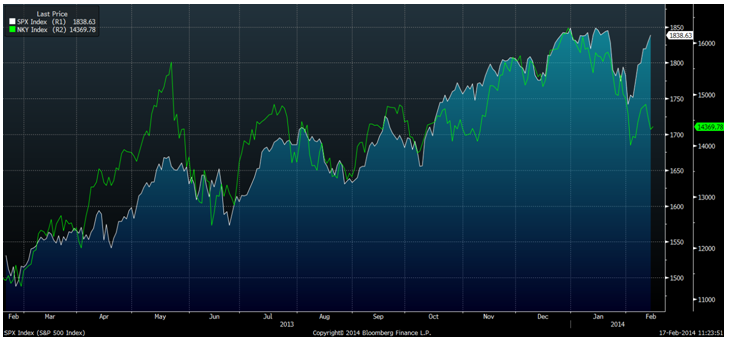
It’s also worth noting the relationship between the Nikkei and S&P500 which is currently showing a large divergence, the correlation between the two is relatively strong at times, and generally the Nikkei catches up to the S&P500 or the S&P catches up to it, so it certainly is a good watch.
Overall though, the S&P 500 is a clear level of heavy resistance, and markets are not a fan of uncharted territory generally. But, with the tapering likely to continue and the US forecast to improve(according to IMF data), I am looking for a pullback when markets realise the reality of the situation.
