The story in the last 24h is one clearly dominated by the market hanging tight to the hopes of the US and China formalizing the first phase of the trade truce. Nonetheless, do you understand why despite such optimism, the Aussie ended as the worst performer last week? Curious to know what makes me bullish in the EUR going forward? Find out in today's report...
Quick Take
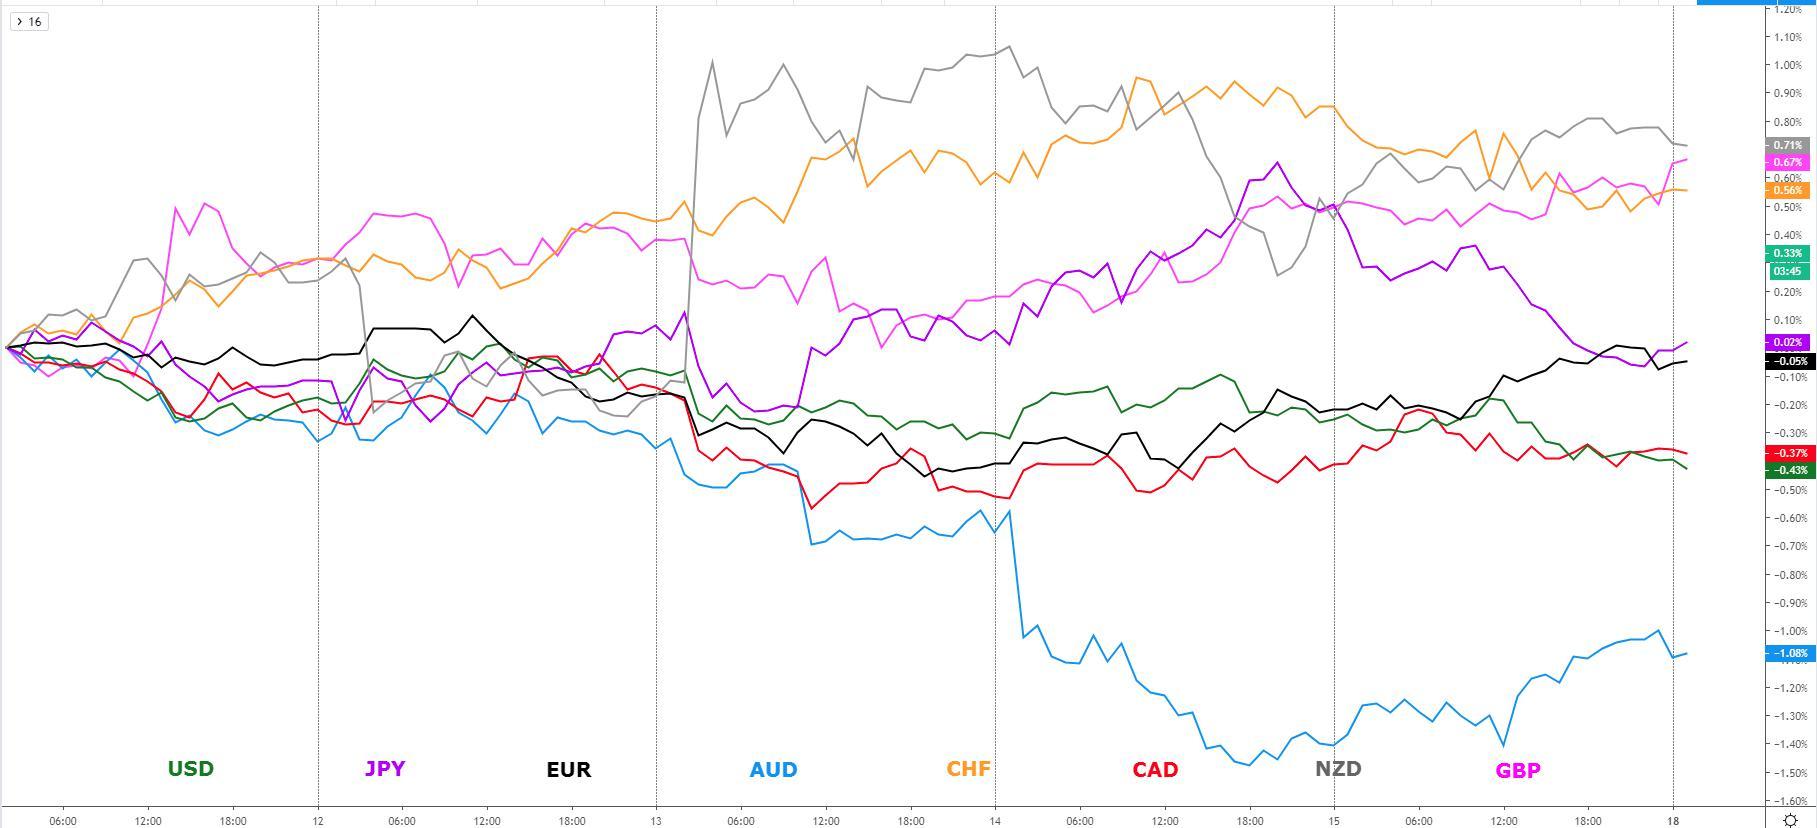
The trifecta of new all-time highs in the primary US stock indices (S&P 500, Nasdaq, Dow Jones) was not ignored by Forex traders, allowing for a strong reversal of the buy-side flows in the funding currencies, which up to that point on Friday, had drawn most of the demand interest. The retracement in the JPY and CHF allowed the GBP and NZD, both emboldened by British political news and the lingering positive momentum by the RBNZ keeping its powder dry on rates.
The ebullient mood in equities, even if not reflected in global yields, was not an impediment for the market to re-engage in bidding up a depressed Aussie, despite ending as the main under-performer for the week as the interest rate cuts by the RBA are firmly on the table on the back of the big miss in Australia's employment numbers the prior day. The USD and CAD, amid the lack of fundamental-driven events, traded in lockstep to the soft side last week, with the AUD the only currency performing worse than the North Americans. Lastly, the EUR kept finding follow-through demand as the market appears to finally mark up the price of the single currency after a period of what looked in the charts a long accumulations campaign intraday.
Narratives In Financial Markets
* The Information is gathered after scanning top publications including the FT, WSJ, Reuters, Bloomberg, ForexLive, Institutional Bank Research reports.
Trifecta of all-time highs in equities: The surge in US stocks won’t abate, with a trifecta of fresh all time highs in the S&P 500, Dow Jones and Nasdaq taking place as the market holds onto hopes that the US and China will be able to finalize the Phase One of a long-overdue trade deal shortly.
Stocks bought on liquidity, trade hopes: The heavy-weight S&P 500 has now printed weekly gains for the last 6 weeks, reflecting the rampant mood as the environment is again dominated the more ample liquidity in the system provided by the Fed and further fueled by hopes of a reflationary environment if the US and China can end up hashing out the first phase of the trade deal.
US-China maintain constructive rhetoric: Over the weekend, it’s been reported that the US and China negotiators had 'constructive senior level discussions', with Steve Mnuchin and Robert Lighthizer speaking with Liu He on Saturday, according to a statement from the Chinese Commerce Ministry. An agreement was reported to maintain close communication, the statement said. White House economic adviser Larry Kudlow said late last week that the US and China are down to the final strokes though "not done yet."
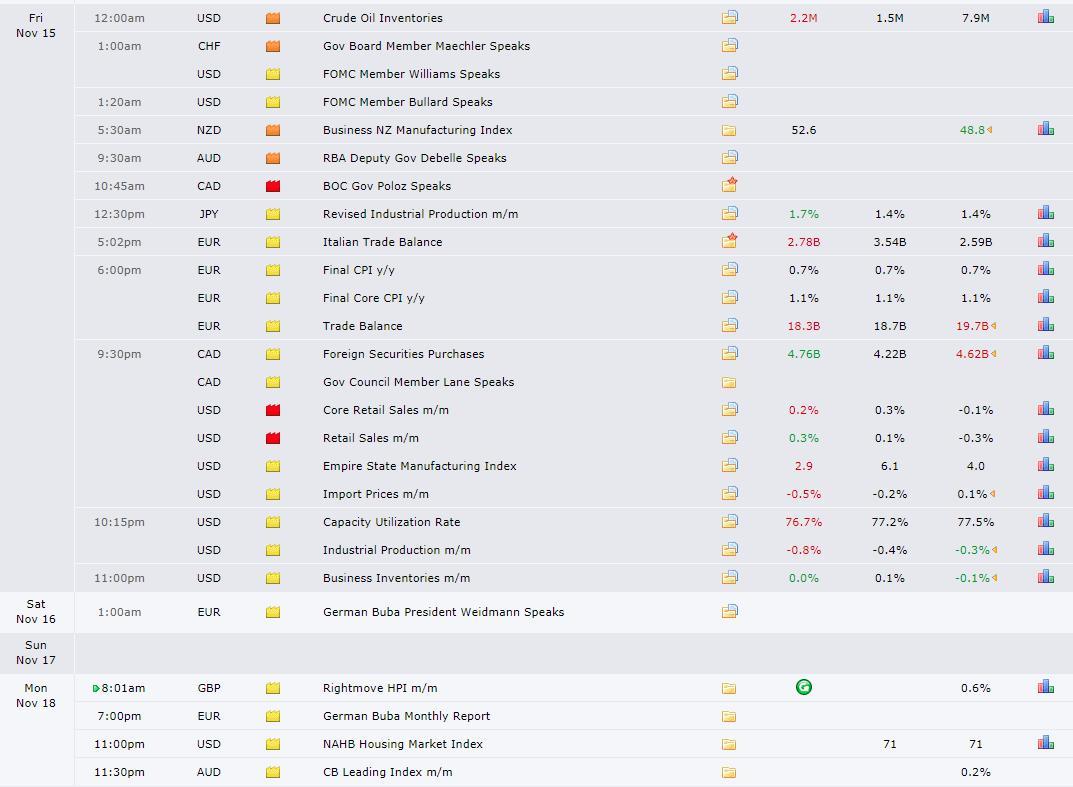
US retail sales, Ind production a secondary driver: US advance retail sales for October came at 0.3% vs 0.2% estimate, which represents a decent recovery from last month’s -0.3% print. The control group stood at 0.3% vs 0.3% estimate. This last measure, which excludes food services, car dealers, building materials, and gasoline stations has a tendency to be the real gauge of underlying consumer demand. Overall, the data is a slightly positive input for the USD playing into the view that the US economy remains sustained in part due to consumers. On the flip side, the US industrial production for October came at -0.8% vs -0.4% estimate. While the data may have been influenced by the GM strike, this is the lowest reading since 2009 and a clear red flag that the trade war is feeding badly into the manufacturing sector.
Canadian data strengthens BOC rate cut outlook at the margin: The flat numbers in Canada’s existing home sales at 0.0% vs 1.3% estimate won’t act as an input to stimulate much demand into the Canadian Dollar. At the margin, it reinforces the notion that the BoC may opt for the previously telegraphed insurance rate cut in the short run.
GBP keeps finding demand on political news: In the UK election front, the Brexit party has stood down from 43 non Tory seats where the Tories came in 2nd in 17 in the last election of which 11 are Labour. In the upcoming election in December, the Conservatives need 326 states to obtain a majority vs 317 seats held currently. The line of thinking here, which led to further momentum in the Pound, is that if the conservatives can obtain an extra 8, they’d be able to secure a majority and hence a stronger mandate to execute on their wishes of a resolution in the Brexit saga.
RBNZ Feb meeting a 'live one': The Reserve Bank of New Zealand's Christian Hawkesby, Assistant Governor/GM Economics, Financial Markets and Banking, said that February monetary policy meeting is 'live'. For the rate cut to eventuate, it would require the outlook to change though, Hawkesby said.
PBOC prepares the market for limited stimulus: On Saturday, the PBoC released its Q3 Monetary report, outlining the sluggish investment as growth keeps slowing down and industrial production stays soft. The report detailed that Monetary policy will “properly handle the short-term pressure,” essentially vowing to provide further stimulus as needed without overly aggressive to balance out the leveraging risks.
Not a whole lot in the calendar this week: For the week ahead, the RBA, FOMC and ECB minutes will be published, Canada’s CPI will also come into focus as will a speech by BOC Governor Poloz. To end the week, ECB President Lagarde will speak at the European Banking Congress, while Europe and the US will publish flash manufacturing/services PMIs, with Canada due to release the latest retail sales data.
Recent Economic Indicators & Events Ahead
Source: Forexfactory
Professional Insights Into FX Charts
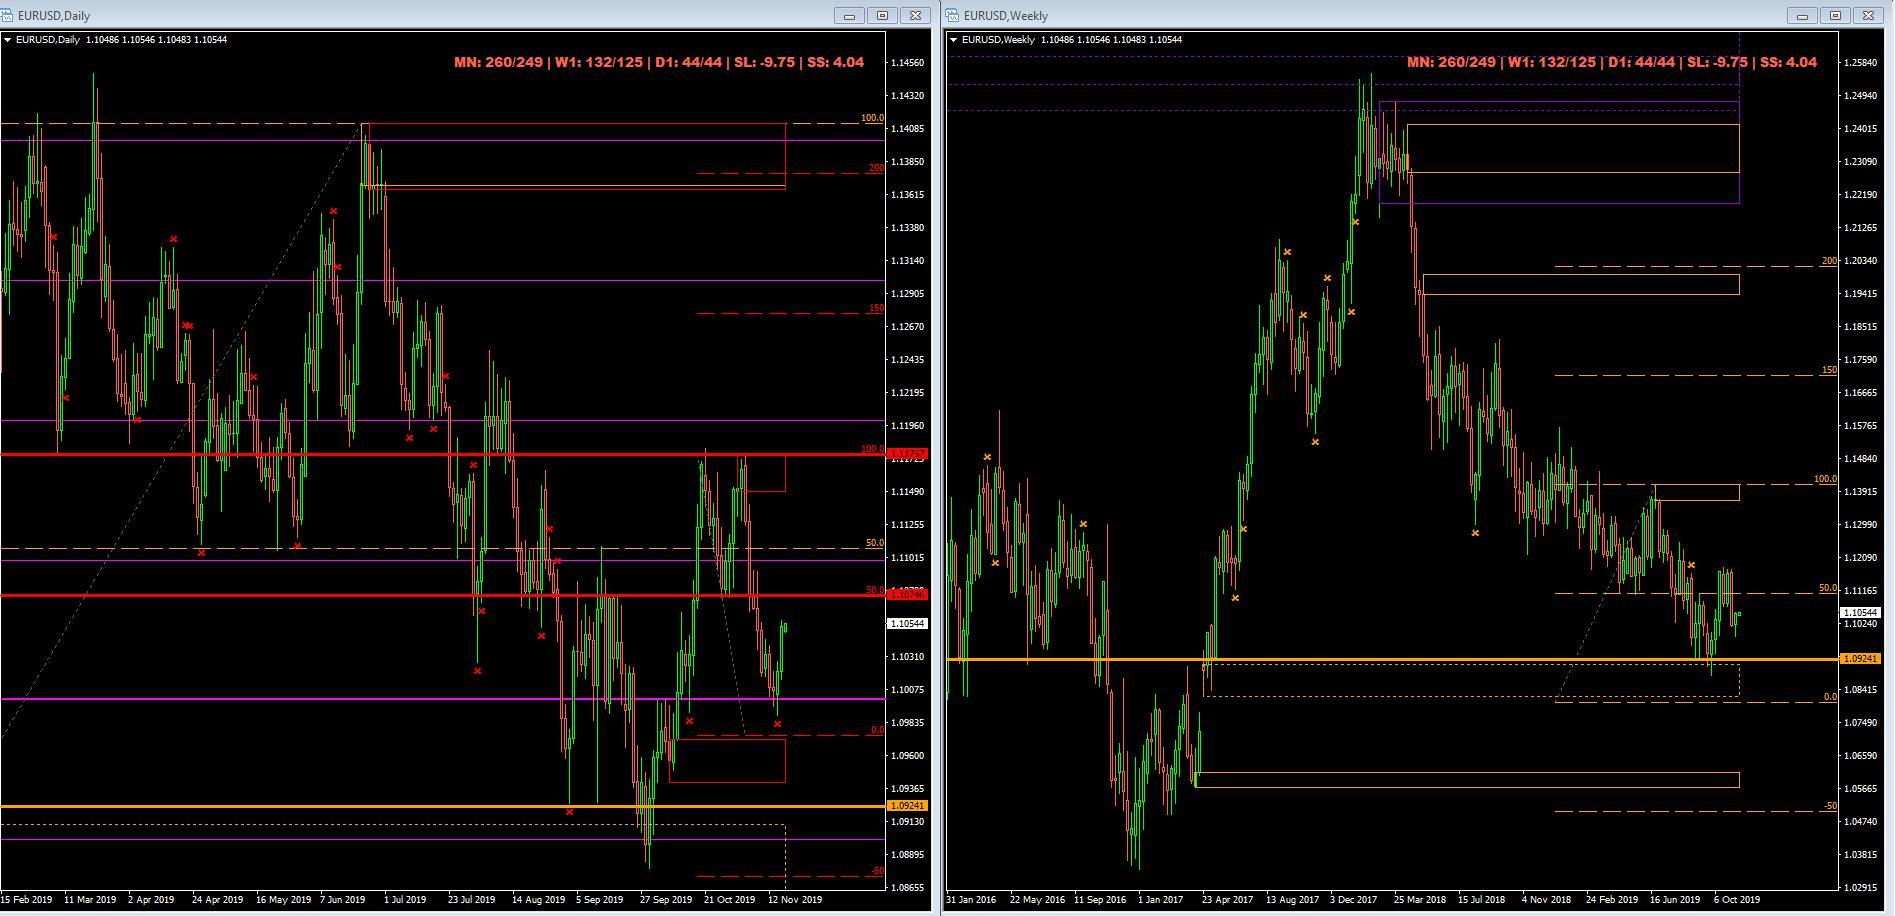
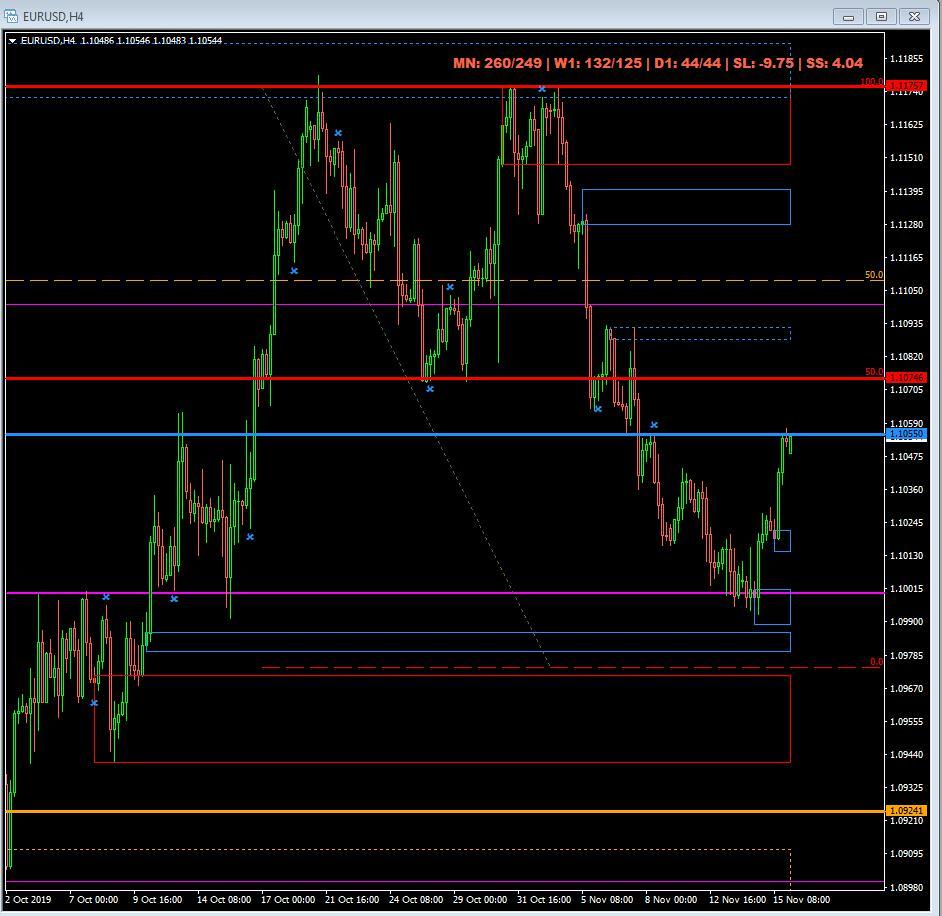
The chart I will keep concentrating my attention to kickstart the week is the EUR/USD as the case to turn more constructive on its outlook remains a sensible strategy. I am personally looking to exploit buys of EUR inventory on weakness with the reasoning detailed below:
- The Oct candle formation was a monthly bullish outside candle. There have been 10 instances since the GFC that this pattern has occurred. Without exception, the next few months at the minimum, the directional biases has turned towards the direction of the outside bar formation.
- The pair is bouncing off a level of weekly demand with the strong departure in May 2017 as the reference to identify that imbalance. This is the demand area in control now.
- The market structure in the weekly has shifted to printing higher highs, with the buying of Euros off the lows last week further evidence that the market is looking to further validate the bullish structure by carving out a higher low (more work needs to be done).
- The pair has found re-invigorated buy-side interest off the round number 1.10 after approaching the level in a compression pattern, which communicates the re-balance of short and accumulation into long side positions.
- Any reinstatement of longs on setbacks finds strong and fresh areas of demand as a backup starting at the 1.1020/25 as seen by the blue box followed by pool of liquidity where a cluster of bids is also expected to protect the downside.
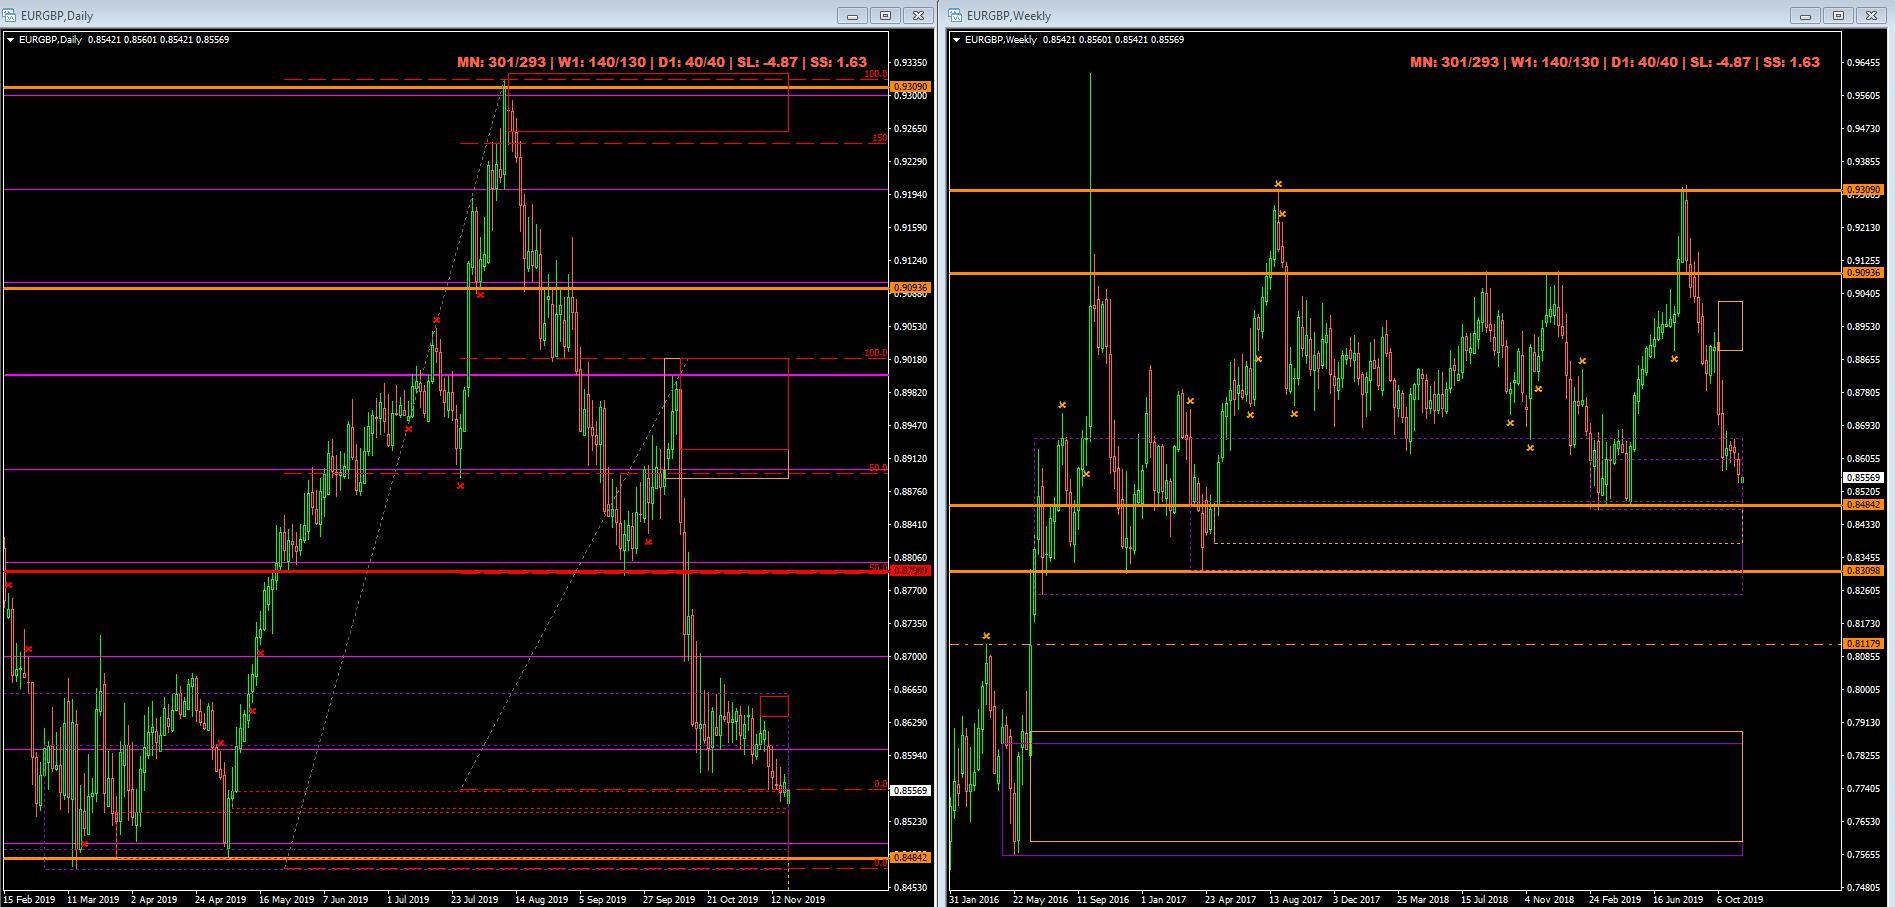
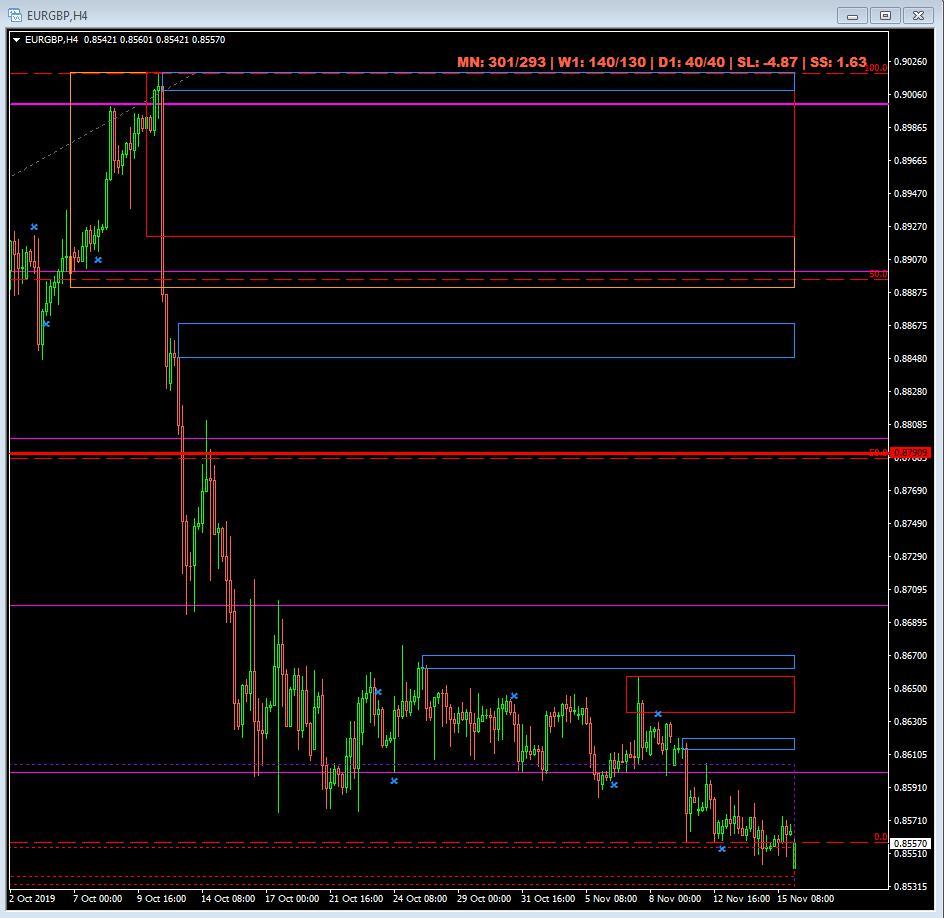
The second chart to outline a potential shift in flows, even if much will depend on the UK general election outcome, includes the EUR/GBP. I’d like to simply focus on the technical aspect in this scenario, and why in my opinion, playing longs can be structurally attractive as it offers a solid asymmetric risk reward. Let’s look in the bullet points below what makes me bullish.
- The weekly chart shows a bullish structure as the last significant swing to the upside broke into new highs, hence at the bare minimum, a retest of the double bottom from Q1 this year should attract plenty of bids (back up vicinity).
- The price is retesting a partially consumed area of demand in the weekly chart, which is certainly an area that in the past has made enough merit to absorb sell-side pressure.
- The 100% measured move from the last significant breakout point has been hit, an area where a partial or complete termination of the daily downtrend must be accounted for as it is in these areas where market makers and profit taking bundled together create buy-side pressure for an eventual reversion back to the mean.
- On the daily chart, the market has entered an area of demand, partially consumed by now, but adding to the confluence for an eventual rebound.
- By looking at the H4 chart, the compression at the lows can be interpreted as an accumulation of longs before a potential markup in prices.
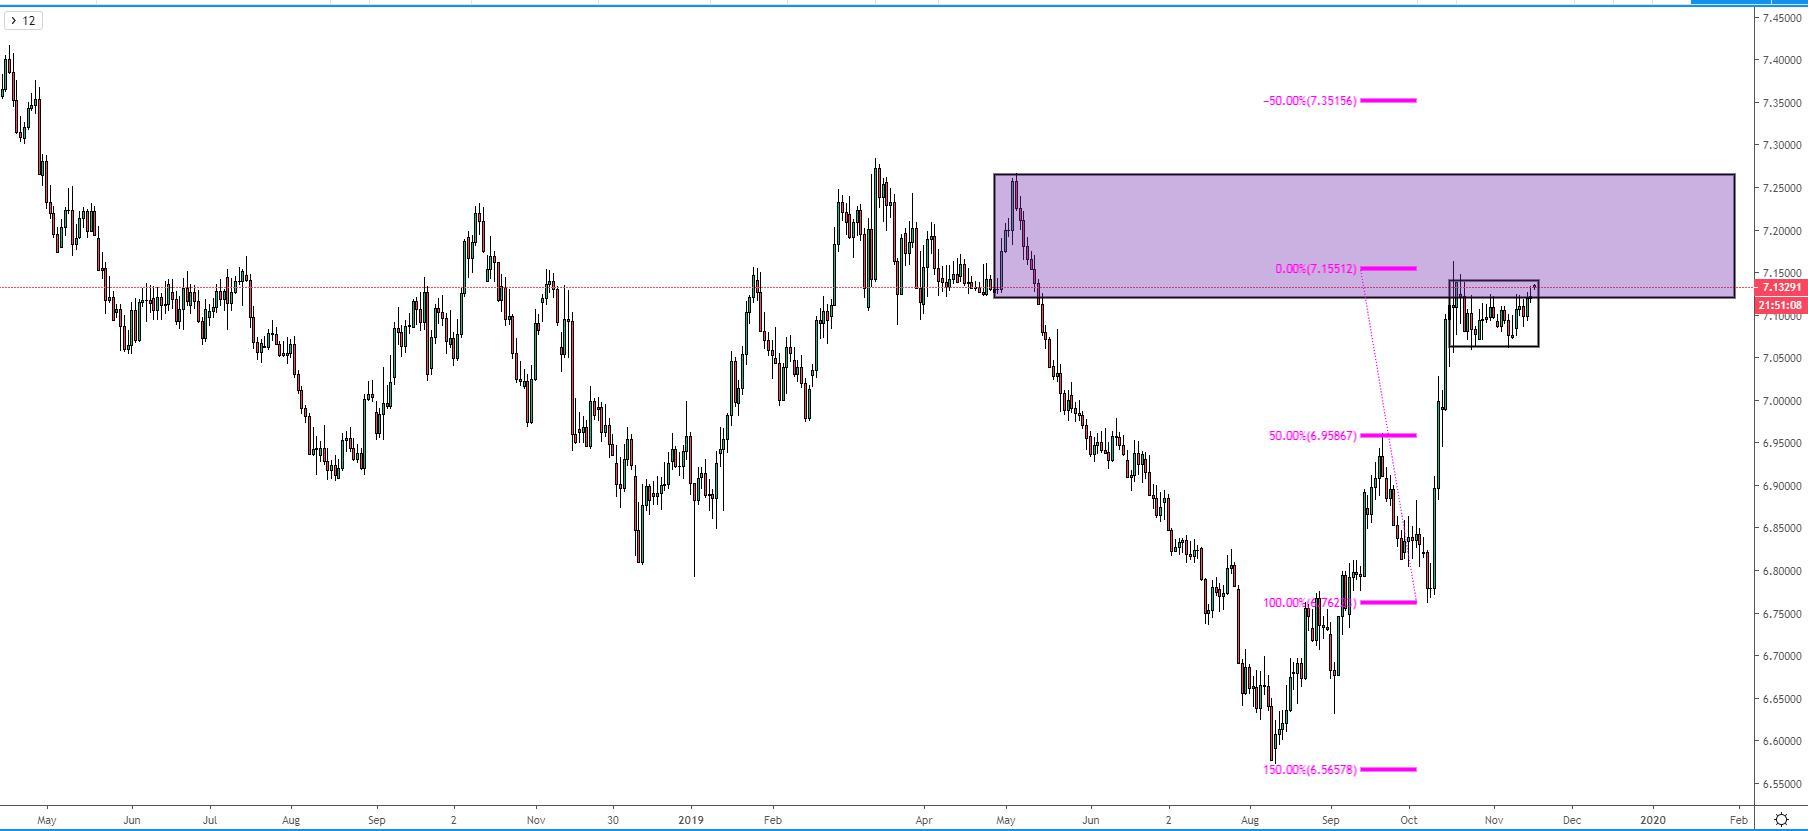
- The GBP index chart is facing an area of monthly supply, further reinforcing the notion that if the GBP is t find renewed selling interest, it could be at this intersection.
Important Footnotes
- Risk model: The fact that financial markets have become so intertwined and dynamic makes it essential to stay constantly in tune with market conditions and adapt to new environments. This prop model will assist you to gauge the context that you are trading so that you can significantly reduce the downside risks.
- Cycles: Markets evolve in cycles followed by a period of distribution and/or accumulation.
- POC: It refers to the point of control. It represents the areas of most interest by trading volume and should act as walls of bids/offers that may result in price reversals. The volume profile analysis tracks trading activity over a specified time period at specified price levels. The study reveals the constant evolution of the market auction process.
- Tick Volume: Price updates activity provides great insights into the actual buy or sell-side commitment to be engaged into a specific directional movement. Studies validate that price updates (tick volume) are highly correlated to actual traded volume, with the correlation being very high, when looking at hourly data.
- Horizontal Support/Resistance: Unlike levels of dynamic support or resistance or more subjective measurements such as Fibonacci retracements, pivot points, trendlines, or other forms of reactive areas, the horizontal lines of support and resistance are universal concepts used by the majority of market participants. It, therefore, makes the areas the most widely followed and relevant to monitor.
- Trendlines: Besides the horizontal lines, trendlines are helpful as a visual representation of the trend. The trendlines are drawn respecting a series of rules that determine the validation of a new cycle being created. Therefore, these trendline drawn in the chart hinge to a certain interpretation of market structures.
- Fundamentals: It’s important to highlight that the daily market outlook provided in this report is subject to the impact of the fundamental news. Any unexpected news may cause the price to behave erratically in the short term.
- Projection Targets: The usefulness of the 100% projection resides in the symmetry and harmonic relationships of market cycles. By drawing a 100% projection, you can anticipate the area in the chart where some type of pause and potential reversals in price is likely to occur, due to 1. The side in control of the cycle takes profits 2. Counter-trend positions are added by contrarian players 3. These are price points where limit orders are set by market-makers.
