
The market Tuesday was remarkable for its uniform theme: the risk of too-low inflation. First the Riksbank cut its key rate for the first time in a year in response to too-low inflation and signalled that it probably wouldn’t start raising rates until the start of 2015, a quarter later than previously stated. The move came in response to two consecutive months of month-on-month declines in prices. Then the UK announced a lower-than-expected CPI for November. Producer prices were also below estimate, showing diminishing upstream inflationary pressures as well. Next was a surprise downward revision to the EU core CPI for November. On the other hand, US CPI accelerated slightly while core inflation remained stable at +1.7%, close to the Fed’s 2.0% target (although admittedly that target uses a different measure of inflation). This suggests that the US does not face deflationary pressures, unlike Europe, and supported the dollar by making it more likely that the FOMC would decide to begin tapering today.
We saw the impact of the problem of too-low inflation in the surprise ECB rate cut in November. It appears that the trend has by no means dissipated. On the contrary, it seems to be spreading and intensifying. I believe this is likely to be one of the major market themes for 2014. It’s particularly important as countries struggle to dig themselves out from under a mountain of debt, because deflation increases the real burden of debt and further depresses an economy. How central banks that are already hitting up against the zero bound for nominal interest rates deal with this problem will be one of the major issues facing the market. The different trend in prices between the US and Europe and the resulting different bias in central bank policy is likely to be one factor that helps the dollar to recovery vs the euro in 2014, in my view.
Today the feature will of course be the FOMC’s decision on monetary policy. A Bloomberg poll of 68 economists shows that most do not expect the Fed to begin tapering off its $85bn in monthly bond purchases today. I think that they will, although of course the decision is finely balanced. If they do decide not to taper, then I would expect the dollar to sell off, as there are still some people who do expect it to start today. The high-beta currencies that tend to move along with stock markets (AUD, CAD, NZD) would probably tend to do best on this scenario, while JPY might underperform as Tokyo stocks rally. On the other hand, the most bullish outcome for the dollar would be that they start to taper and make no attempt to soften the blow through additional forward guidance or other measures, such as reducing the amount of interest that they pay on reserves. That would probably hurt the EM currencies that have performed well recently, such as HUF, INR and KRW. BRL, ZAR and TRY could also suffer as currencies with large current account deficits. Combinations between those extremes – start tapering but with various additional measures on interest rates – would result in a more modest USD rally.
Today’s indicators may not mean much as the market awaits the Fed. They started off with Japan’s seasonally adjusted trade deficit widening further in November as import growth exceeded export growth, but USD/JPY was virtually unchanged. Next the ANZ Business Confidence survey rose in December, but NZD/USD weakened nonetheless. During the European day, UK unemployment is expected to stay unchanged at 7.6% in October. This is a key indicator for Britain, as the Bank of England has pledged to keep rates stable at least until unemployment gets down to 7%, so any unexpected move in the rate is bound to affect sterling. Also the Bank of England will release the minutes of its recent Monetary Policy Committee meeting. In the US, housing starts for November are expected to be up 954k in November. This figure hasn’t been released since August so it’ll be hard to make sense out of it. Building permits in November are expected at 990k, down from 1039k in October.
The Market
EUR/USD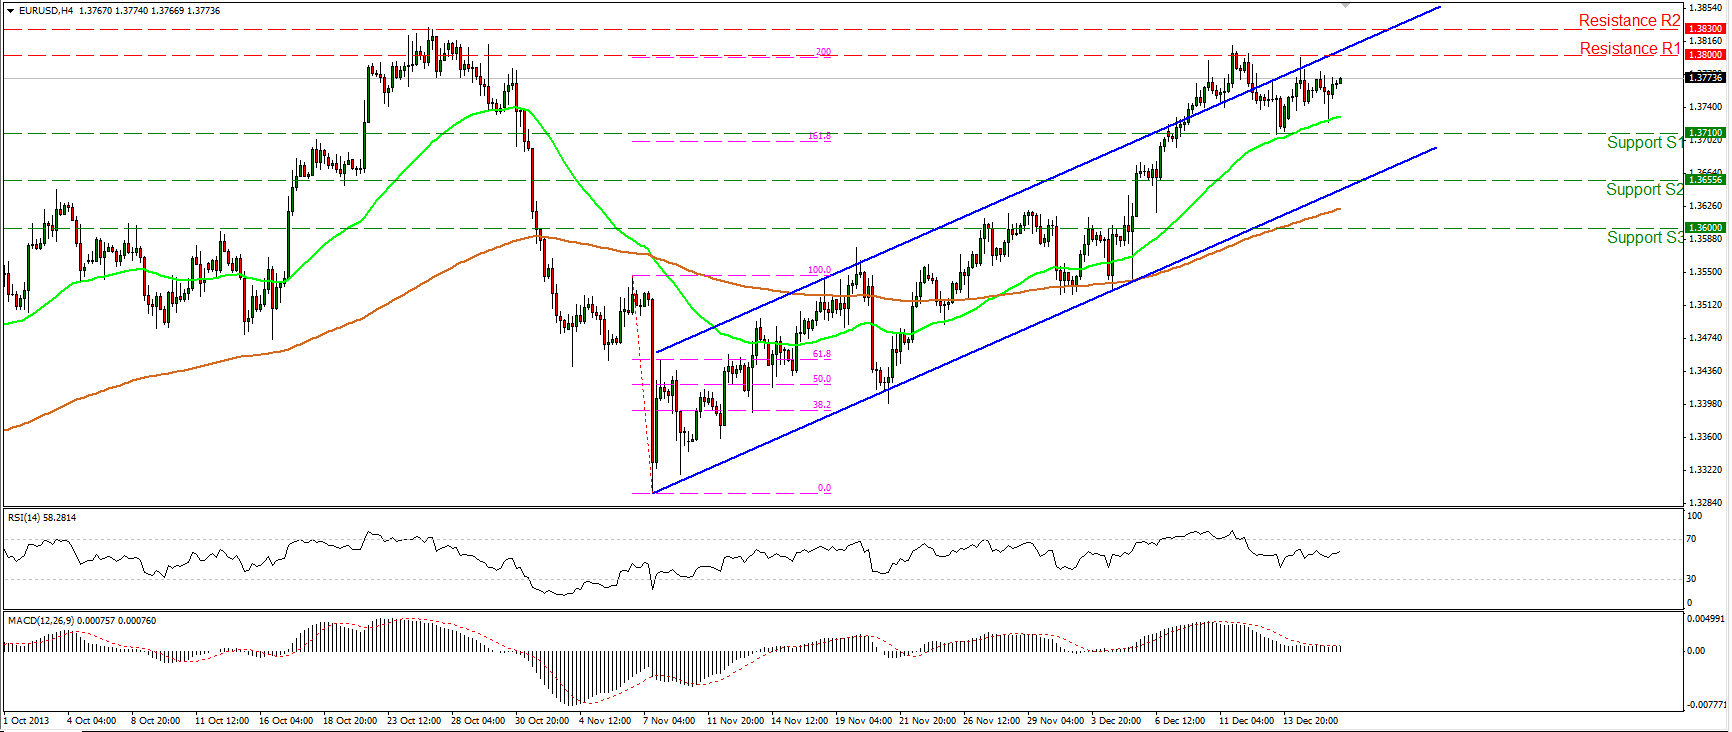 EUR/USD Hourly Chart" title="EUR/USD Hourly Chart" height="732" width="1732">
The EUR/USD consolidated on Tuesday, remaining between the support of 1.3710 (S1) and the key resistance of 1.3800 (R1) which coincides with the 200% extension level of the decline prior to the uptrend. An upward escape of the resistance area between 1.3800 (R1) and October’s highs at 1.3830 (R2), would signal the continuation of the uptrend. Only a dip below 1.3710 (S1) would be a reason to assume bearish extensions. As long as the pair is forming higher peaks and higher troughs of the same degree and is trading above both moving averages, the uptrend remains in effect.
• Support: 1.3710 (S1), 1.3655 (S2), 1.3600 (S3).
• Resistance: 1.3800 (R1), 1.3830 (R2), 1.935 (R3).
USD/JPY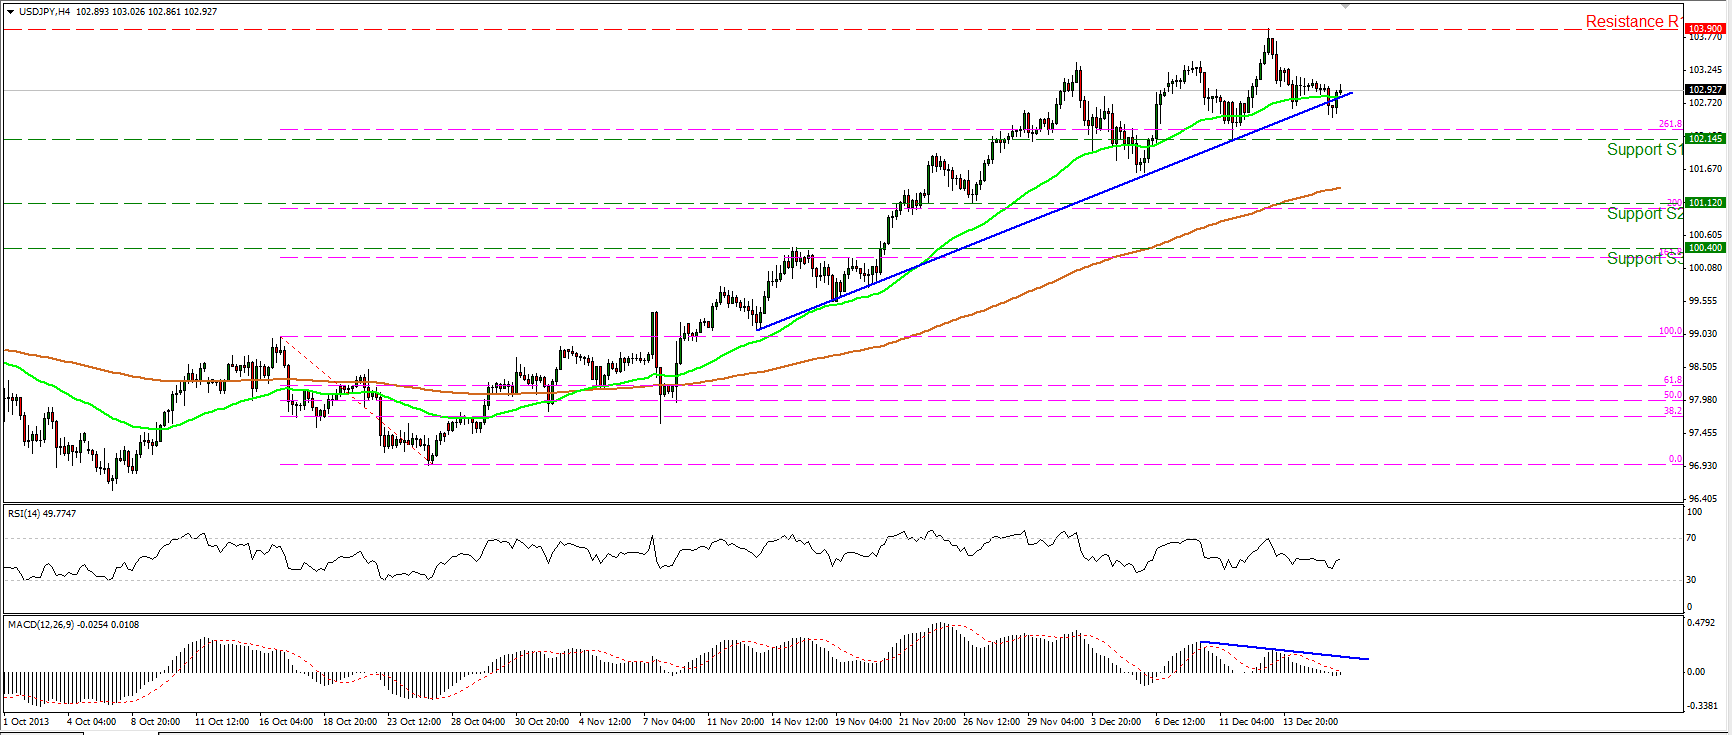 USD/JPY Hourly Chart" title="USD/JPY Hourly Chart" height="732" width="1732">
The USD/JPY rebounded near the blue support line and the 50-period moving average. If the longs are strong enough to push the price higher, they may drive the rate for another test at the 103.90 (R1) resistance barrier. On the other hand, a dip below 102.14 (S1) would have bearish implications targeting the support level at 101.12 (S2). The negative divergence identified between the MACD and the price action remains in effect, indicating that the momentum of the short-term trend is weakening. On the daily and weekly charts, the subsequent move upon the escape of the symmetrical triangle remains in effect, thus I would consider any downward movements on the shorter time-frames as retracements of the longer term upward direction.
• Support: 102.14 (S1), 101.12 (S2), 100.40 (S3).
• Resistance: 103.90 (R1), 105.24 (R2), 106.87 (R3).
EUR/GBP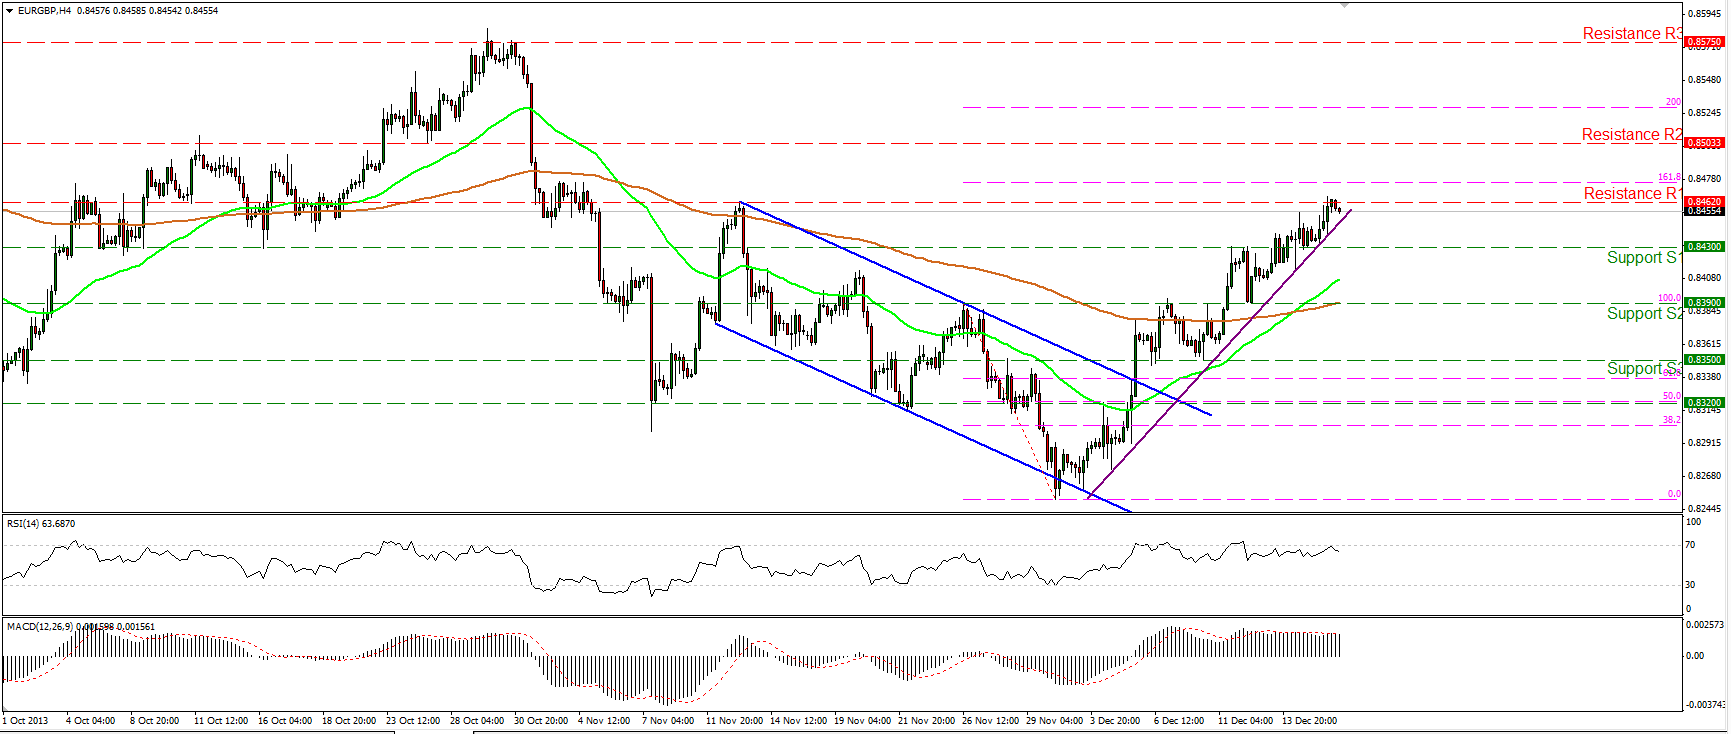 EUR/GBP Hourly Chart" title="EUR/GBP Hourly Chart" height="732" width="1732">
The EUR/GBP moved higher and managed to reach the 0.8462 (R1) resistance level. An upward escape of the area between that hurdle and the 161.8% Fibonacci extension level of the 26th Nov - 2nd Dec bearish wave may trigger further bullish extensions towards the 200% extension level of the aforementioned decline. The 50-period moving average crossed above the 200-period moving average, increasing the probabilities for further advance. My only concern is that the RSI found resistance at its 70 level and moved lower, thus I would not exclude a price pullback before the bulls prevail again.
• Support: 0.8430 (S1), 0.8390 (S2), 0.8350 (S3).
• Resistance: 0.8462 (R1), 0.8503 (R2), 0.8575 (R3).
Gold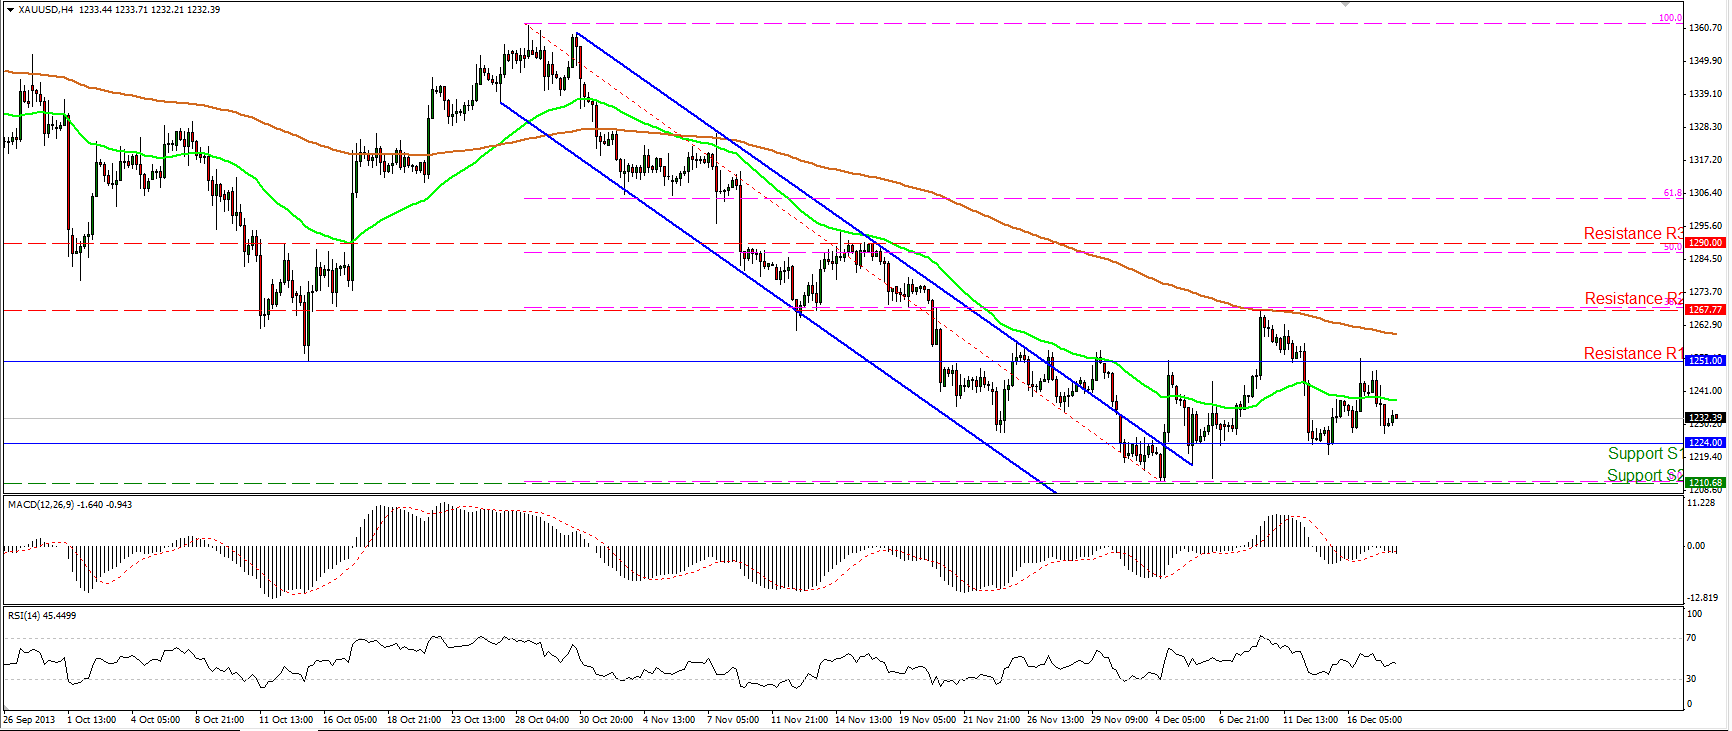 XAU/USD Hourly Chart" title="XAU/USD Hourly Chart" height="732" width="1732">
Gold moved lower yesterday but remained between the 1224 (S1) support and the resistance of 1251 (R1). Since the metal is not in a trending phase and continues moving in a sideways mode, I remain neutral until we have a clearer picture. A clear violation of the low at 1210 (S2) may confirm that the 4th-10th Dec advance was just a correction at the 38.2% Fibonacci retracement level of the prevailing downtrend and may turn the bias to the downside again.
• Support: 1224 (S1), 1210 (S2), 1180 (S3).
• Resistance: 1251 (R1), 1267 (R2), 1290 (R3).
Oil
WTI also moved in a consolidative mode, remaining above the 97.00 (S1) support barrier. I would expect the bulls to drive the battle higher and challenge once again the resistance of 98.81 (R1). A violation of that resistance may signal the continuation of the uptrend and trigger bullish extensions towards the next hurdle at 101.10 (R2). Both momentum studies lie near their neutral levels, giving no clues for the next directional movement of the price. Nonetheless, as long as the 50 period moving average remains above the 200-period moving average and as long as WTI remains within the purple upward sloping channel, I consider the bias to the upside.
• Support: 97.00 (S1), 95.36 (S2), 92.00 (S3).
• Resistance: 98.81 (R1), 101.10 (R2), 103.15 (R3).
BENCHMARK CURRENCY RATES - DAILY GAINERS AND LOSERS
MARKETS SUMMARY
- English (UK)
- English (India)
- English (Canada)
- English (Australia)
- English (South Africa)
- English (Philippines)
- English (Nigeria)
- Deutsch
- Español (España)
- Español (México)
- Français
- Italiano
- Nederlands
- Português (Portugal)
- Polski
- Português (Brasil)
- Русский
- Türkçe
- العربية
- Ελληνικά
- Svenska
- Suomi
- עברית
- 日本語
- 한국어
- 简体中文
- 繁體中文
- Bahasa Indonesia
- Bahasa Melayu
- ไทย
- Tiếng Việt
- हिंदी
Risk Of Too-Low Inflation Dominates FX Trading
Published 12/18/2013, 06:59 AM
Updated 07/09/2023, 06:31 AM
Risk Of Too-Low Inflation Dominates FX Trading
Latest comments
Loading next article…
Install Our App
Risk Disclosure: Trading in financial instruments and/or cryptocurrencies involves high risks including the risk of losing some, or all, of your investment amount, and may not be suitable for all investors. Prices of cryptocurrencies are extremely volatile and may be affected by external factors such as financial, regulatory or political events. Trading on margin increases the financial risks.
Before deciding to trade in financial instrument or cryptocurrencies you should be fully informed of the risks and costs associated with trading the financial markets, carefully consider your investment objectives, level of experience, and risk appetite, and seek professional advice where needed.
Fusion Media would like to remind you that the data contained in this website is not necessarily real-time nor accurate. The data and prices on the website are not necessarily provided by any market or exchange, but may be provided by market makers, and so prices may not be accurate and may differ from the actual price at any given market, meaning prices are indicative and not appropriate for trading purposes. Fusion Media and any provider of the data contained in this website will not accept liability for any loss or damage as a result of your trading, or your reliance on the information contained within this website.
It is prohibited to use, store, reproduce, display, modify, transmit or distribute the data contained in this website without the explicit prior written permission of Fusion Media and/or the data provider. All intellectual property rights are reserved by the providers and/or the exchange providing the data contained in this website.
Fusion Media may be compensated by the advertisers that appear on the website, based on your interaction with the advertisements or advertisers.
© 2007-2025 - Fusion Media Limited. All Rights Reserved.