


Sign up to create alerts for Instruments,
Economic Events and content by followed authors
Free Sign Up Already have an account? Sign In
Please try another search

It has been about a month since the last earnings report for Regal Beloit Corporation (NYSE:RBC) . Shares have lost about 1.7 % in that time frame, underperforming the market.
Will the recent negative trend continue leading up to its next earnings release, or is RBC due for a breakout? Before we dive into how investors and analysts have reacted as of late, let's take a quick look at the most recent earnings report in order to get a better handle on the important drivers.
Regal Beloit Q4 Earnings in Line, Revenues Up Y/Y
Regal Beloit reported decent fourth-quarter 2017 results, on the back of modest organic growth and positive order trends. On a GAAP basis, the company reported a net income of $51.5 million or $1.15 per share compared with $45.6 million or $1.01 per share in the year-earlier quarter. The significant year-over-year improvement was backed by higher revenues.
In the reported quarter, adjusted earnings were $1.14 per share compared with $1.04 in the year-ago quarter. The figure improved considerably year over year and came in line with the Zacks Consensus Estimate.
For 2017, Regal Beloit recorded GAAP earnings of $213 million or $4.74 per share compared with $203.4 million or $4.52 per share in 2016. Adjusted earnings for 2017 were $4.87 per share compared with $4.44 in the previous year.
Net sales increased to $820.7 million from $758.1 million in the year-earlier quarter, largely driven by organic growth across all segments. Moreover, quarterly revenues beat the Zacks Consensus Estimate of $790 million. For 2017, the company recorded net sales of $3,360.3 million compared with $3,224.5 million in 2016.
GAAP operating income improved to $78.3 million from $70.1 million in the prior-year quarter. Adjusted operating income was $79.5 million compared with $72.2 million in the year-ago quarter. Adjusted operating margin came in at 9.7%, up 20 basis points compared with the prior-year quarter.
Segmental Analysis
Revenues from the Power Transmission Solutions segment increased 13.2% year over year to $196.6 million. Sales were driven by rise in demand in the oil & gas and renewable energy end markets and in the distribution channel. However, GAAP operating margin decreased to 12.2% from 13% in the prior-year quarter.
Net sales in the Commercial and Industrial System segment were $407.7 million, up 10.4% year over year owing to broad-based global end market strength in both OEM and distribution channels. Operating margin at the segment increased to 5.9% from 5.6% in the prior-year quarter.
Net sales from the Climate Solutions segment were $216.4 million, up 0.6% year over year. Operating margin of the segment also improved to 14% from 12.5% in the year-ago quarter.
Balance Sheet and Cash Flow
At year-end 2017, Regal Beloit’s cash and cash equivalents were $139.6 million while long-term debt was $1,039.9 million compared with the respective tallies of $284.5 million and $1,310.9 million in the year-ago period. The company paid down $74.3 million of debt in the quarter under review.
Net cash from operating activities for 2017 totaled $291.9 million, down from $442.3 million in the year-ago period. In 2017, free cash flow was 106.4% of net income or $226.7 million compared with the respective tallies of 185.4% and $377.1 million in 2016.
Guidance
For 2018, Regal Beloit anticipates organic growth in range of low to mid-single digit single digits and expects to improve its adjusted operating margin for the third consecutive year. Additionally, it projects adjusted earnings per share guidance in the range of $5.35-$5.75 while GAAP earnings are expected in the range of $5.19–$5.59.
How Have Estimates Been Moving Since Then?
In the past month, investors have witnessed an upward trend in fresh estimates. There have been three revisions higher for the current quarter. While looking back an additional 30 days, we can see even more upward momentum. There has been only one move up in the last two months.
Regal Beloit Corporation Price and Consensus
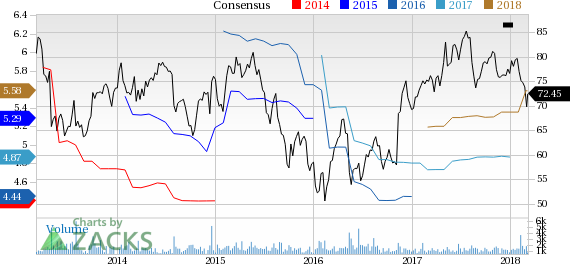
Regal Beloit Corporation Price and Consensus | Regal Beloit Corporation Quote
VGM Scores
Currently, RBC has a poor Growth Score of F, however its Momentum is doing a lot better with a B. Charting a somewhat similar path, the stock was allocated a grade of A on the value side, putting it in the top quintile for this investment strategy.
Overall, the stock has an aggregate VGM Score of B. If you aren't focused on one strategy, this score is the one you should be interested in.
Our style scores indicate that the stock is more suitable for value investors than momentum investors.
Outlook
Estimates have been trending upward for the stock and the magnitude of these revisions looks promising. It comes with little surprise RBC has a Zacks Rank #2 (Buy). We expect an above average return from the stock in the next few months.
Shares of Alibaba (NYSE:BABA) are on a tear to start off 2025. The consumer discretionary and tech stock is up by 52% this year as of the Feb. 25 close. The company’s cloud...
Every investor should know the term CEP, or customer engagement platform, because it is central to businesses' use of AI. CEPs provide software services to connect and communicate...
As markets try to look through the blizzard of policy changes flowing out of Washington, the crowd has shifted its preferences considerably in recent weeks based on a sector lens....
Are you sure you want to block %USER_NAME%?
By doing so, you and %USER_NAME% will not be able to see any of each other's Investing.com's posts.
%USER_NAME% was successfully added to your Block List
Since you’ve just unblocked this person, you must wait 48 hours before renewing the block.
I feel that this comment is:
Thank You!
Your report has been sent to our moderators for review
Add a Comment
We encourage you to use comments to engage with other users, share your perspective and ask questions of authors and each other. However, in order to maintain the high level of discourse we’ve all come to value and expect, please keep the following criteria in mind:
Enrich the conversation, don’t trash it.
Stay focused and on track. Only post material that’s relevant to the topic being discussed.
Be respectful. Even negative opinions can be framed positively and diplomatically. Avoid profanity, slander or personal attacks directed at an author or another user. Racism, sexism and other forms of discrimination will not be tolerated.
Perpetrators of spam or abuse will be deleted from the site and prohibited from future registration at Investing.com’s discretion.