Oil Prices Set For Further Congestion. New Trend Only When...

Published 09/03/2020, 07:32 AM
Updated 07/09/2023, 06:31 AM

The daily chart for oil makes for interesting reading following the extended congestion phase which has seen the commodity struggle to break away and move higher, constantly testing and retesting the $43 per barrel area. Yesterday’s move lower confirmed the weakness for oil at present closing on a wide spread down candle and supported with high volume as we retrace to the volume point of control which sits at the $41 per barrel area. A classic example of Wyckoff’s third law of effort and result with volume and price in agreement.
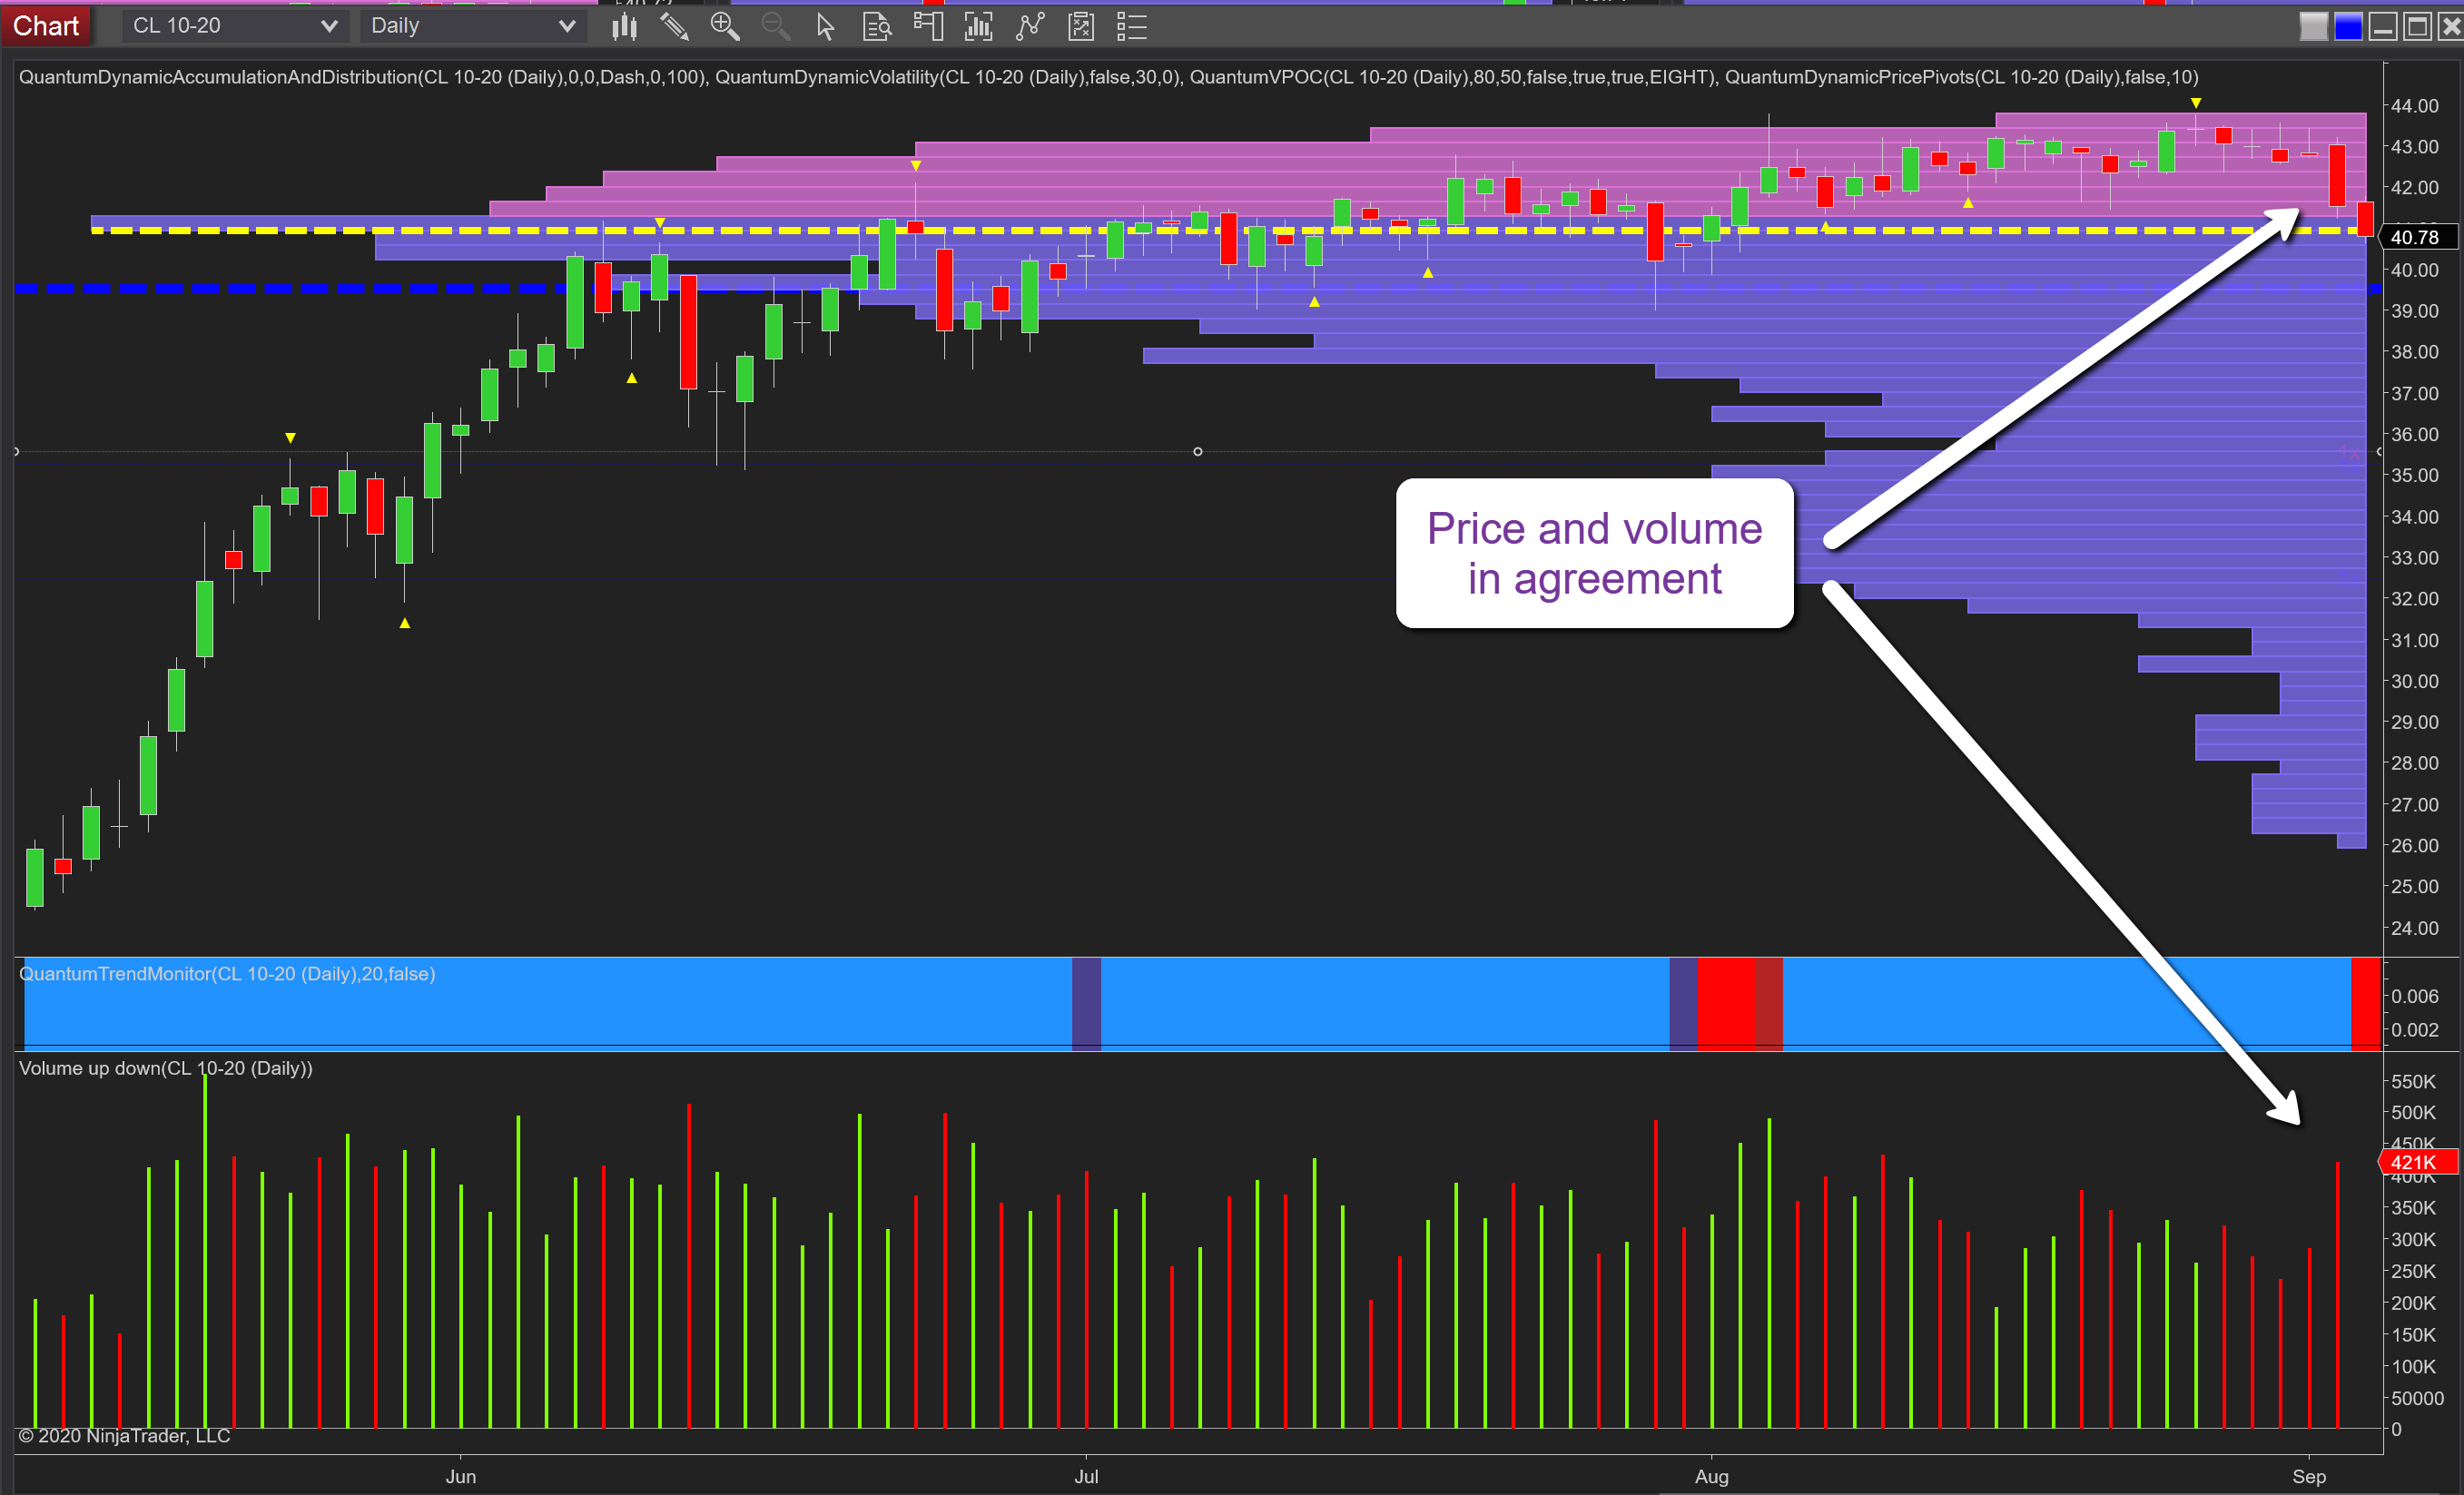
Oil Daily Chart

The yellow dashed line is the fulcrum of the market and defines the greatest concentration of volume on the chart. The VPOC indicator also introduces the concept of time to the volume price relationship and so describes the concentration of volume on the Y-axis of the chart along with the associated high volume and low volume nodes. In the short term, given we are now trading back at the volume point of control we can expect to see further price congestion in this region and with a strong level of potential support below in the $39.70 per barrel area as denoted with the blue line of the accumulation and distribution indicator, this is also likely to come into play in the near future.

In summary, expect to see further congestion at this level, and a new trend will only be established once we break away from the VPOC, a move that has to be associated with strong volume to confirm any such move.

Latest comments

Loading next article…
Risk Disclosure: Trading in financial instruments and/or cryptocurrencies involves high risks including the risk of losing some, or all, of your investment amount, and may not be suitable for all investors. Prices of cryptocurrencies are extremely volatile and may be affected by external factors such as financial, regulatory or political events. Trading on margin increases the financial risks.
Before deciding to trade in financial instrument or cryptocurrencies you should be fully informed of the risks and costs associated with trading the financial markets, carefully consider your investment objectives, level of experience, and risk appetite, and seek professional advice where needed.
Fusion Media would like to remind you that the data contained in this website is not necessarily real-time nor accurate. The data and prices on the website are not necessarily provided by any market or exchange, but may be provided by market makers, and so prices may not be accurate and may differ from the actual price at any given market, meaning prices are indicative and not appropriate for trading purposes. Fusion Media and any provider of the data contained in this website will not accept liability for any loss or damage as a result of your trading, or your reliance on the information contained within this website.
It is prohibited to use, store, reproduce, display, modify, transmit or distribute the data contained in this website without the explicit prior written permission of Fusion Media and/or the data provider. All intellectual property rights are reserved by the providers and/or the exchange providing the data contained in this website.
Fusion Media may be compensated by the advertisers that appear on the website, based on your interaction with the advertisements or advertisers.
© 2007-2025 - Fusion Media Limited. All Rights Reserved.