
This second part of our multi-part article researching the massive upside price move in silver recently should cause skilled technical traders to begin sweating a bit. In our opinion, nothing moves metals more than fear and a move like this in silver, recently, is a very clear indication that global traders fear the current global economic ability to sustain market valuation levels in the face of bigger and more sustained economic and COVID-19 virus crisis events.
Will Next Shot Be A Direct Hit?
A series of potentially destructive economic events are lining up over the next 6 to 12+ months and they all relate to the efficiency of the economic recovery many traders have banked their long positions on. Will the COVID-19 virus subside before the end of 2020? Will the U.S. consumers/workers resume their ability to earn incomes? Will the U.S. and global businesses survive the contraction event taking place throughout the globe? Will local city, state and other entities survive the contraction in tax revenues, fees, and extended costs related to this massive destructive economic event? Will the stock market continue to rally in the face of all of these issues and what other “unknowns” are about to befall us?
The reality of the situation is that precious metals have already fired a massive warning shot across our bow and skilled technical traders need to start paying attention. Precious metals don't move higher by 12% to 15% like silver just did for no reason at all. A massive new level of fear must have hit causing global traders to push silver prices above $23 recently. Silver, the “other precious metal” has been stalled below $19 for many months – even while gold pushed well above the $1,750 level and higher. This big breakout in silver is nothing more than a phenomenal warning for all traders and investors – be warned: RIsks are skyrocketing higher.
We want to highlight a few of our recent research posts to help you better understand what is happening with precious metals and what to expect in the future.
Sept. 24, 2019: Is Silver About To Become The Super-Hero of Precious Metals?
May 29, 2020: Metals Nearing Critical Momentum For New Parabolic Rally
July 13, 2020: Gold & Silver Measure Moves
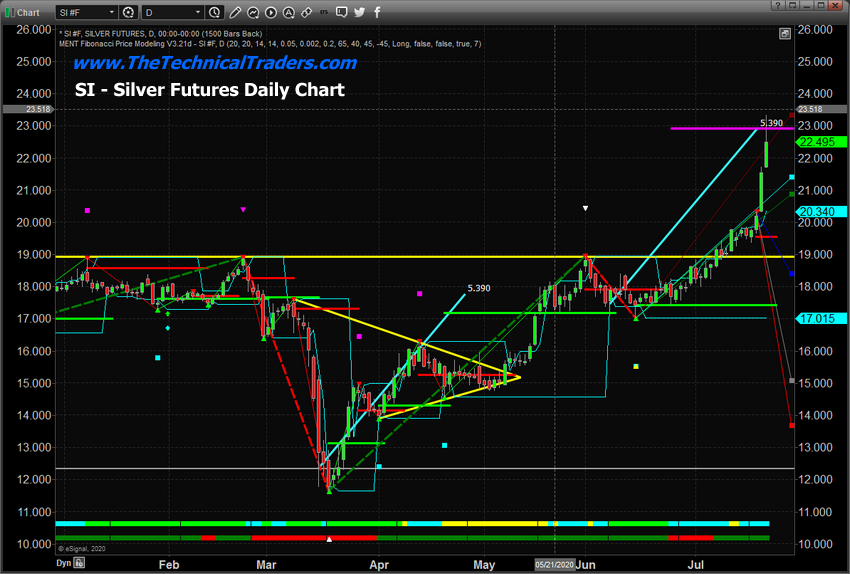
Silver Daily Chart
This daily silver chart highlights the series of “measured moves” our research team wrote about on July 13, 2020. These $5.40 price advances seem to happen with some degree of regularity and we believe they will continue until an upside parabolic break out of this range takes place.
That means when an upside move extends beyond the $5.40 measured move level and price attempt to move dramatically higher, then the continuation of these measured moves may be over.
Ultimately, our earlier research into technical patterns in silver suggests a $25.50 to $26 upside price target. Yet, broader market research suggests a move above $75 to $85 in silver ($3,750 to $4,995+ in gold) is not out of the question. What would it take for silver to rally above $70 per ounce you may ask?
Our research team believes a broader economic, credit, and consumer event would likely have to take place for precious metals to rally to these levels. Fear drives a lot of price action in metals and when investors fear valuation levels or future expectations, they often hedge their portfolios by investing in precious metals. When a big move happens, like what we've just seen in silver, we interpret it as “fear has materialized.” What are traders so fearful about? They are likely fearful of the current high price levels in the U.S. stock market and future expectations related to consumers, trade, credit/debt, and other factors of the global economy.
SPY Monthly Chart
We've been writing about the potential for a series of economic events to unfold over the next 6+ months where consumers, cities/states, and businesses simply collapse because of the lack of earning capabilities associated with the COVID-19 virus event. Many years ago, we wrote that “isolated economic events that disrupt smaller segments of the markets are more manageable than prolonged destructive events.” We believe the current COVID-19 virus event will transition into a prolonged economic event where a 20% to 30%+ extended contraction in revenues for many businesses, consumers, and city/state/federal governments could produce massive future risks that are still somewhat “unknown.”
We've also written about super-cycle events and warned all of our followers in August 2019 to prepare for a massively destructive super-cycle event to take place late in 2019 and early in 2020. We authored this research post in July 2019 warning all of our followers of the pending collapse in the U.S. and global markets related to super-cycles and other technical patterns.
What we expect to happen now is an extension of the crisis event until a bottom is established. This SPY (NYSE:SPY) monthly chart highlights some of the research our team recently completed and also suggests that a broader market failure (downside price rotation) event may take place over the next 3+ months (prior to the U.S. Presidential Elections), where new deeper lows may be established. The GREEN ARCING LINE on this chart represents our proprietary Fibonacci Price Amplitude Arcs, an adaptation to traditional Fibonacci Price Theory, which suggests price levels are already 7% to 9% above major resistance. If the U.S. stock market falters near current levels and begins to move broadly lower, we should expect a series of moderately violent downside price moves to target the $208 level on the SPY, while gold and silver extend their upside price advance. Fear will drive metals higher, while the potential downside price event in the SPY takes place.
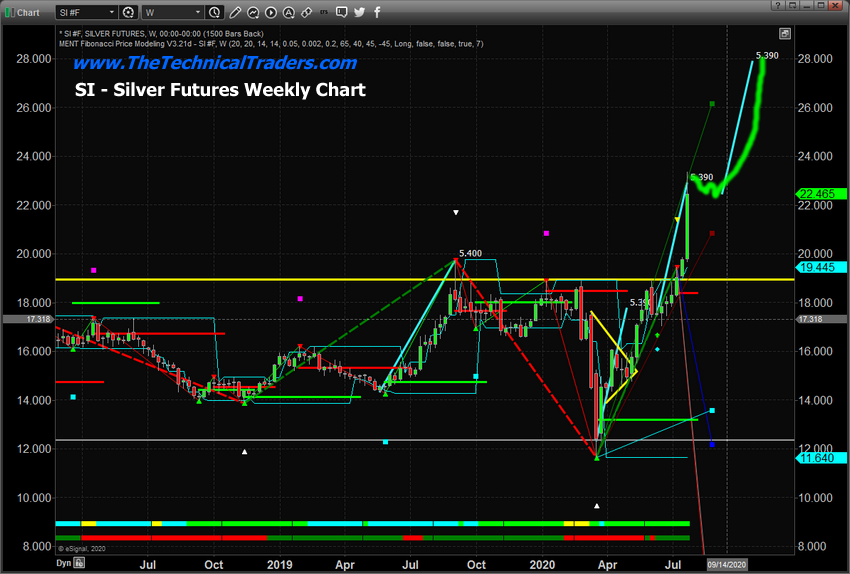
Silver Weekly Chart
Our next upside price targets in silver are near $28 (a full 24%+ higher than current price levels). These measured price moves act as a stair-step process for the price to consolidate/base, begin a moderate upside move, peak, then repeat the process all over again. Beyond the $28 price target level, the next measured move target is $32.50. If silver reaches the $28 or $32.50 level, you can assume fear is very present in the global markets and Gold should already be trading above $2,100 (or higher). The combination of gold and silver moving higher in unison should be a very clear warning that global traders don't trust the current valuation levels of the global stock markets.
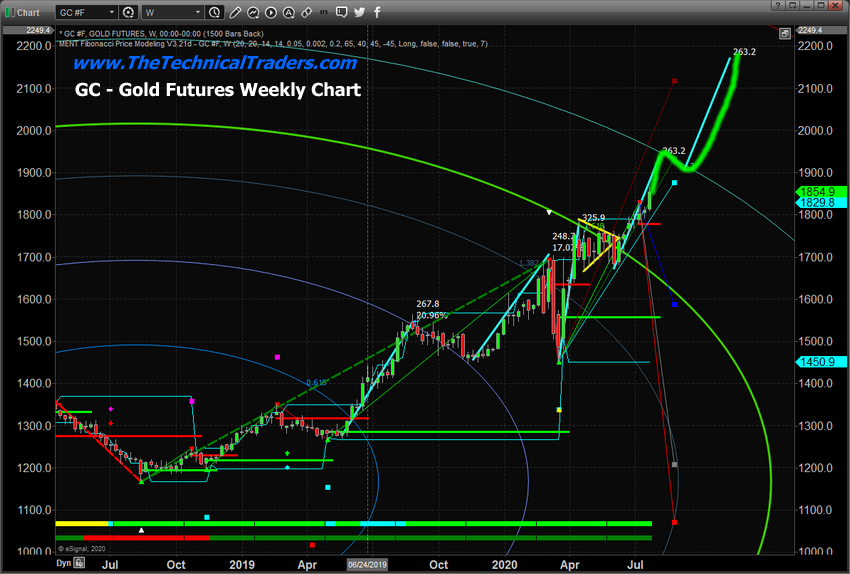
This weekly gold chart highlights the next measured move targets for gold. Although gold has yet to reach the current measured move target, we don't believe it will take more than 3 to 4 weeks for gold to print a price level above $1,950. After this big move in silver, we are moderately confident that gold will continue to rally as well. The bigger question for gold is what happens after $2,000? Will it rally to $3750 as we predict? Will it rally to $5,500 or higher?
Ultimately, the upside price peak levels in gold will relate to the extent of the fear and uncertainty that is present as a result of the continued fallout from the COVID-19 virus event and the series of revenue/earnings-based contractions we believe are just below the surface right now. Over the next 6+ months, we believe a series of new crisis events will unfold which will highlight just how destructive the COVID-19 crisis has been. When consumers and businesses
lose 25% to 35% of their earning capacity (or more) and more than 15% of the total U.S. population has been displaced from work/business because of these economic shutdowns – one has to expect some type of economic contraction to take place.
Honestly, it would be foolish to think the U.S .Fed can offset 150+ million U.S. consumers spending activities, home buying, rentals, loan payments, and other activities. About 25% of the normal U.S. GDP levels represent more than
$5.5 trillion – that's a big hit to the markets if it turns out to be real.
Gold Weekly Chart
We urge all of our followers to stay very cautious and to properly position your portfolios to address the risks that we feel are pending. Yes, the U.S. stock market has rallied substantially recently, but if you were paying attention to precious metals and what was really happening to U.S. businesses and U.S. consumers, you'll suddenly realize the U.S. Fed and foreign investors piling into technology stocks is not the same things as a healthy and robust U.S. economy (like we had in 2017 and 2018).
The ultimate peak in the U.S. economy took place in January/February 2018. After that peak, our proprietary price modelling systems continue to suggest the U.S. stock market and economy has been contracting. The longer-term super-cycles suggest the real bottom in the markets won't happen until somewhere between 2021 and 2023. We have a long way to go before we see where this ultimate bottom is really going to set up.