
The last few weeks have certainly been interesting as we have watched Central Banks globally go “all in.” From the G-20 meeting where an accord was apparently reached to both the ECB and Federal Reserve jumping on board to support ailing economies.
While I have maintained a cautious stance in portfolio allocations since May of last year, I have reiterated many times that interventions by Central Banks could change the shorter-term dynamic of the markets from bearish back to bullish. These past few weeks have seen exactly that occur.
The question that we must primarily try and answer this week is whether enough “technical repair” has been completed to warrant an increase in equity exposure in the portfolio model.
First, let’s review the portfolio model performance as compared to the relative benchmark since last May when I first suggested reducing equities.
WHAT DID I MISS?
It is always interesting when I read the comments made on my strategy by others. The most common is:
“Yes, but you missed the rally over the last ## of weeks, so obviously your methodology doesn’t work.”
Unfortunately, during the response/rebuttal process I discover numerous similarities between all of these individuals. They have generally only been investing post-financial crisis, have very little money and are generally “speculating” in some of the more dangerous of manners. During the next major market reversion, their arrogance will be turned into humility. It is unfortunate they will not listen to the advice of others who have lived through 30-years of market volatility and have already received their degree from USIM, or the “University of Stupid Investing Mistakes.”
I have absolutely ZERO, none, nada, interest in chasing an index. For myself, and the clients that I work for, an index has absolutely no relation to specific goals or time frames. As I stated in “Benchmarking Is A Losing Bet:”
“The major learning points regarding the fallacy of chasing a ‘benchmark index’ are:
- The index contains no cash
- It has no life expectancy requirements – but you do.
- It does not have to compensate for distributions to meet living requirements – but you do.
- It requires you to take on excess risk (potential for loss) in order to obtain equivalent performance – this is fine on the way up, but not on the way down.
- It has no taxes, costs or other expenses associated with it – but you do.
- It has the ability to substitute at no penalty – but you don’t.
- It benefits from share buybacks – but you don’t.
In order to win the long-term investing game, your portfolio should be built around the things that matter most to you.
– Capital preservation
– A rate of return sufficient to keep pace with the rate of inflation.
– Expectations based on realistic objectives. (The market does not compound at 8%, 6% or 4%)
– Higher rates of return require an exponential increase in the underlying risk profile. This tends to not work out well.
– You can replace lost capital – but you can’t replace lost time. Time is a precious commodity that you cannot afford to waste.
– Portfolios are time-frame specific. If you have a 5-years to retirement but build a portfolio with a 20-year time horizon (taking on more risk) the results will likely be disastrous. (This is called a ‘duration mismatch.’)“
For myself, and those that I work for, I truly am investing for relatively long-term time frames of 5-20 years on average. This is because most people that have enough money saved up to actually warrant needing a professional manager are generally between the ages of 45-60 years of age, hence 5-20 year time frames before retirement.
Therefore, spending 5-years to get back to even following a major market reversion is not only unacceptable but devastating to the attainment of retirement objectives.
With this understanding, we can now look at how the portfolio model faired relative to its benchmark and the S&P 500 directly. (While March is not yet complete, I have updated performance through Thursday’s close.)

(Disclaimer: The information provided below is for informational and educational purposes only. The following does not constitute a recommendation or solicitation and no warranties or representations are being made. Past performance is no guarantee of future results and use of this information is at ones on risk and peril.)
As you can see, the risk adjusted model has had substantially less volatility since the beginning of last year. Despite being primarily in cash and fixed income since last year, all that has been missed is roughly $500. Given the volatility since the beginning of this year, I am fairly certain that many would trade $500 for avoiding the plunges seen last summer and the beginning of this year. So, what did you really miss?
While the portfolios have been much more cautiously allocated over the last several months, the risk has been a break by the markets to the downside. As I examined in last week’s missive, the fundamental, economic and technical backdrop is certainly NOT conducive for higher levels of long-term equity risk.
However, I have always balanced those arguments with a full understanding that massive, coordinated interventions by Central Banks could nullify the “bear case” in the short-term.
DID YELLEN RELEASE THE BULL?
So, the question we must now answer, is whether the recent actions by the BOJ, ECB and the Federal Reserve have provided the markets with enough “fire power” to return the markets back to a bullish trend?
Let’s start with a short-term (daily) view of the S&P 500 as their are some interesting observations.

I have added some notations to the chart I posted earlier this week. As I stated then, there is a lot going on in this chart.
- The shaded areas represent 2 and 3-standard deviations of price movement from the 125-day moving average. I am using a longer-term moving average here to represent more extreme price extensions of the index. The last 4-times prices were 3-standard deviations below the moving average, the subsequent rallies were very sharp as short positions were forced to cover.
- The top and bottom of the chart show the overbought/sold conditions of the market. The recent rally has responded as expected from recent oversold conditions. With the oversold condition now exhausted, the potential for further upside has been greatly reduced.
-
The RED circles denote the previous two times that the markets were as overbought as they are now. Notice the condition peaked during the middle of the advance and began to wane as the rally reached its conclusion. In both previous events, the ensuing correction was fairly sharp.
- The red and yellow dashed lines show the current descending trend lines that continue to provide resistance to the advance. Furthermore, the easiest path for prices continues to be lower as downward resistance continues to be built. The arching dashed blue line shows the change of overall advancing to now declining price trends.
However, if the “bulls” have indeed return to the market, as is being suggested by the mainstream media, we should see longer term measures of market momentum and relative strength turning more positive.

As you will notice, there has been virtually no improvement in longer-term indicators at this point that would suggest a more “bullish” optimism is prevailing in the markets.
At the very bottom of the chart above is the number of stocks trading ABOVE the 200-dma on the S&P 500. Currently, with the overall index trading well above the 200-dma, only 58.6% of stocks are currently doing the same. This suggests a rather narrow rally over the last month and explains the lack of momentum of the overall index.
Even on a shorter-term time frame the recent rally has failed to reverse the negative trend of the market which has been a hallmark of “broadening topping” process seen at the peaks of the last two markets.

While my “emotions” are currently screaming to start increasing equity allocations at this juncture, there are several reasons why my discipline is keeping me from doing so currently:
- The market is GROSSLY overbought in the short-term and will have either a mild corrective process or consolidation to allow for an increase in equity exposure.
- Negative trends are still in place which suggests the currently rally, while significant, remains within the context of a reflexive rally.
- Volume is declining on the rally suggesting a lack of conviction.
- This rally looks very similar to the rally last October except the fundamentals are substantially weaker.

NEVSKY ON THE ISSUE
I am not oblivious to the fact that Central Banks have aligned to once again drag forward future consumption to support economic growth, increase inflationary pressures and support higher asset prices. That is their goal. However, the success of their endeavors to date, other than boosting asset prices, have been negligible at best.
This also means that while economic data will continue to drag, the efforts will likely postpone a dip into more “recessionary” waters this year and simply push it forward into next. Simply put, Central Banks are continuing to “rearrange the deck chairs on the Titanic” rather than actually addressing the gaping holes in their respective economies. The belief by the Fed that the U.S. economy is “unsinkable” may eventually be their own undoing.
However, there are many that continue to monitor headline economic data as if it is gospel. There is a belief that government supported agencies are producing dependable economic data that can somehow be used to make investment policy decisions. Nothing could be further from the truth, which will only be made apparent next year when backward revisions reveal the errors in the seasonal adjustments of the data.
But it was Nevsky Capital that really brought this issue home. In a recent letter to their investors informing them of the closing of the firms fund, they stated:
“Data releases have become much less transparent and truthful at both a macro and a micro level. At a macro level the key issue is the ever increasing importance of China and India. China is the world’s second largest economy, but already much larger than the US in a broad swathe of sectors. India will be the world’s third largest economy within a decade. Unfortunately their rise is increasing the global cost of capital because an ever growing share of the most important data they produce is simply not credible. Currently stated Chinese real GDP growth is 7.1% and India’s is 7.4%. Both are substantially over stated. This obfuscation and distortion of data, whether deliberate or inadvertent, makes it increasingly difficult to forecast macro and hence micro as well, for an ever growing share of our investment universe.”
“Assuming we can obtain trustworthy data we then apply logic to produce our forecasts. The validity of this process becomes questionable if economic policy makers do not themselves apply economic logic and in a transparent manner.
Obviously we accept politics can trump economics and political analysis has always been a very big part of our process, but surely never has so much of the world been governed by leaders where the logic of that peculiarly parochial yet multi headed beast – nationalism – trumps all (China, India, Russia, Turkey, South Africa, Malaysia etc. etc.). Almost by definition the path of logic within nationalism is difficult for ‘outsiders’ to follow with any confidence, leading to highly unpredictable and potentially dysfunctional modeling outcomes.”
“The unintended consequences of those new regulations introduced as a result of the GFC, which have largely removed the market making role of investment banks from global equity markets, has coincided with the recent massive increase in market share of both ‘dumb’ index funds and ‘black box’ algorithmic funds to create a situation where equity market volumes have fallen sharply and individual stock volatility has risen dramatically. An initially badly executed order can now inadvertently create a price trend (because there is no longer the cushion to price moves which was in the past provided by market maker inventories) that, as algorithmic funds feast on it, can create a market event even if the initial order was a simple innocent error. Truly – to mix metaphors – butterflies flapping their wings now regularly create hurricanes that stop out fundamentally driven investors who cannot remain solvent longer than the market can remain irrational.
– In such a world dominated by index and algorithmic funds historically logical correlations between different asset classes can remain in place long after they have ceased to be logical.“
I completely agree with Nevsky on this issue. The data is unreliable at best and manipulated at worst. For example, take a look at the chart below.

This chart CLEARLY shows that the number of “Births & Deaths” of businesses since the financial crisis have been on the decline. Yet, each month, when the market gets the jobs report, we see roughly 200k plus jobs created as shown in the chart below.

Included in those reports is an “ADJUSTMENT” by the Bureau of Economic Analysis to account for the number of new businesses (jobs) that were created during the reporting period.
The chart below shows the differential in employment gains since 2009 when removing the additions to the monthly employment number though the “Birth/Death” adjustment. Real employment gains would be roughly 4.43 million less if you actually accounted for the LOSS in jobs given the first chart above.

The “seasonal adjustment” problem runs through the entirety of economic data published by the various government agencies.
Is it intentional? Probably Not. Is it relevant? Absolutely.
Are you willing to bet your life savings on portfolio management strategies dependent on such data?
For all of these reasons, I remain cautious for now. That doesn’t mean I will not change to a more bullish stance next week. However, I would prefer that the weight of evidence supports such a change before taking on additional portfolio risk.
One other point to think about.
If the economy is improving and inflationary pressures are on the rise, then why did the Federal Reserve just become MORE ACCOMMODATIVE with their monetary policy by reducing the number of rate hikes this year from 4 to 2? Furthermore, why did they just lower their economic forecasts….again?

Just something to think about.

THE MONDAY MORNING CALL
While most of the commentary above is for longer-term investors, the very short-term set up of the market is also NOT extremely conducive for increasing equity risk exposure currently.
Andrew Thrasher just penned:
“The S&P 500 has rallied over 10% since the February low, push the index up to its 50-week Moving Average. Meanwhile the Volatility Index (VIX) has declined approx. 47%, sending the ‘fear index’ to its lowest level so far this year. Is this signaling a potential return of stock market volatility?
Currently the VIX is the furthest it’s been from its 50-day MA since the prior lower high in the S&P 500 back in October 2015. As the chart below shows, it’s now more than one standard deviation below the mean based on the distance Volatility historically travels away from its 50-day.
Previous instances of the VIX falling this quickly has led to tough market conditions in the short-term for the stock market.
Fellow See It Market contributor Steve Deppe also shared on Twitter that when the VIX that since 1990 when the index’s 20-day return is less than -30%, the average forward return for the S&P 500 over the next 5, 10, 20, and 40 days has been negative.“

Also, corporate share “buybacks,” which have been a major support of the recent run in the financial markets, are set to go quite as earnings “blackout period” begins.

As also noted by Bloomberg:
“Corporate buybacks are the sole demand for corporate equities in this market,” David Kostin, the chief U.S. equity strategist at Goldman Sachs Group Inc (NYSE:GS)., said in a Feb. 23 Bloomberg Television interview. “It’s been a very challenging market this year in terms of some of the macro rotations, concerns about China and oil, which have encouraged fund managers to reduce their exposure.”
Should the current pace of withdrawals from mutual funds and ETFs last through the rest of March, outflows would hit $60 billion. That implies a gap with corporate buybacks of $225 billion, the widest in data going back to 1998.”

“Kostin said companies tend to enact a blackout period and restrict share repurchases in the month following the end of a calendar quarter, and come back once they’ve reported results. In a market where everyone else is selling, the ebb and flow of corporate actions have amplified volatility. The S&P 500 slumped 11 percent in the first six weeks of the year before staging a rebound.”
WAITING FOR CHANGE
As discussed throughout this weekend’s missive, there is ample evidence suggesting a more cautionary approach remains the correct course of action for now. Therefore, we continue to wait, watch and prepare.
As stated two weeks ago:
“There is now little for us to do except to wait, and watch patiently, for the market to either confirm a ‘bear market,’ OR stabilize and begin to rebuild the bullish supports necessary to allow equity risk to once again be increased.”
Neither situation will make itself apparent in short order, so relax as we let the market dictate what actions we take next. “Guessing” at the markets has not typically been a successful and repeatable strategy. As stated above, while very short-term indicators have improved, the longer-term signals have not.
S.A.R.M. Model Allocation
Working With A Model Allocation
NOTE: The following is for example purposes ONLY. It is in no way a suggestion, recommendation, or implication as to any portfolio allocation model currently in use. It is simply an illustration of how to overweight or underweight a model allocation structure.
Again, this is just for educational purposes, and I am not making any specific recommendations. This is simply a guide to assist you in thinking about your own personal positioning, how much risk you are willing to take and what your expectations are. The closer you want to track the S&P 500 Index, the less fixed income, real estate and cash your portfolio should have. For a more conservative allocation reduce allocations to equities and add more to cash and fixed income.
S.A.R.M. Current
The Sector Allocation Rotation Model (SARM) is an example of a basic well-diversified portfolio. The purpose of the model is to look “under the hood” of a portfolio to see what parts of the engine are driving returns versus detracting from it. From this analysis, we can then determine where to overweight sectors which are leading performance, reduce in areas lagging, and eliminate those areas that are dragging.
Currently, while RISK based sectors have improved somewhat, it is still the defensive oriented sectors that continue to outperform. While these sectors have weakened recently, not surprising given the strength of the recent rally, the outperformance on a relative basis suggests that money flows remain cautiously biased.

Therefore, there have been no changes to S.A.R.M. model in the past week.

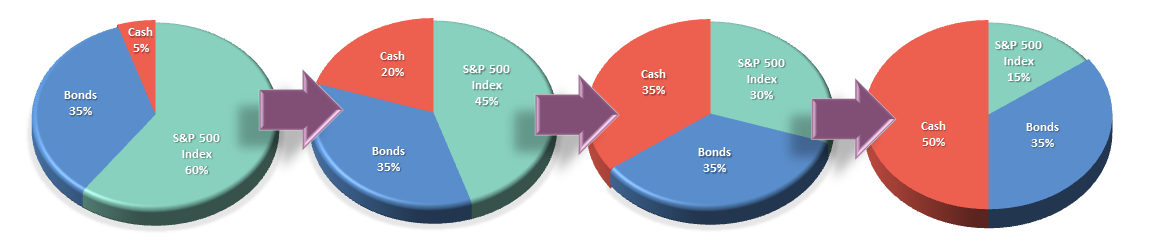
The portfolio model remains unchanged this week with CASH to 50%, 35% in bonds, and 15% in equities.
It is completely OKAY if your current allocation to cash is different based on your personal risk tolerance. This is just a guide.
If the market can pull back and establish a higher low AND simultaneously move the markets back into an oversold condition, such would likely provide a reasonable opportunity to increase short-term equity exposure.
However, for longer-term investors, we need to see an improvement in the fundamental and economic backdrop to support a resumption of the bullish trend. Currently, there is no evidence of that occurring.
THE REAL 401k PLAN MANAGER

There are 4-steps to allocation changes based on 25% reduction increments. As noted in the chart above a 100% allocation level is equal to 60% stocks. I never advocate being 100% out of the market as it is far too difficult to reverse course when the market changes from a negative to a positive trend. Emotions keep us from taking the correct action.
SITTING AT TARGET FOR NOW
While the market rally was quite exceptional over the last few weeks, it has done little to change the currently negative market trends back to positive. As shown in the 401k portfolio manager chart above, all sell signals remain in place currently, and while they improved slightly over the last three weeks, they remain in the negative for now.
However, as I stated two weeks ago:
“…some event (exogenous, monetary or fiscal) could occur which would render such analysis incorrect. If such an event occurs, we will re-evaluate holdings and readjust accordingly.”
Those events were the ECB’s unleashing of their “QE Bazooka” combined with the Fed’s failure to hike interest rates which gave a modest boost to stocks.
As discussed throughout the entirety of this week’s missive, the technical damage to the market remains over the intermediate and longer-term time frames. This suggests the reward is still outweighed by risk and continues to suggest a more cautionary allocation.
Therefore, I reiterate last week’s note:
“With portfolio allocations now reduced to TARGET levels, the only action to currently take is NOTHING. We are now in the position to just WAIT and allow the market to TELL us what it wants to do next.
While many will speculate on a resumption of a “bull market” in the short-term, the RISK of being WRONG far outweighs the possibility that such prognostications are correct.”
Portfolio management is not difficult, it is just a function of letting the markets tell you what it wants to do, rather than “hoping and guessing” at what YOU want it to do.
You are not in control. When you learn to accept that, managing your money becomes vastly easier.
Current 401-k Allocation Model
The 401k plan allocation plan below follows the K.I.S.S. principal. By keeping the allocation extremely simplified it allows for better control of the allocation and a closer tracking to the benchmark objective over time. (If you want to make it more complicated you can, however, statistics show that simply adding more funds does not increase performance to any great degree.)

401k Choice Matching List
The list below shows sample 401k plan funds for each major category. In reality, the majority of funds all track their indices fairly closely. Therefore, if you don’t see your exact fund listed, look for a fund that is similar in nature.
