- U.S. futures linger on the cautious side ahead of Fed announcement
- Peugeot-Fiat merger talks fail to prop up STOXX 600
- Asian shares drop on slimming trade hopes
- Pound climbs as U.K. PM Johnson wins support for December election
Key Events
European shares and futures on the S&P 500, Dow and NASDAQ 100 wavered around neutral levels this morning, as traders geared up for an overwhelmingly expected rate cut by the Federal Reserve.
Although they showed some signs of mild optimism by the late European morning, investors seemed to remain overall cautious ahead of a what is currently seen as the last rate cut for some time to come. The Fed has indeed come a long way this year, from Chair Jerome Powell’s “autopilot” comment on winding down accommodation, to three consecutive cuts and its balance sheet's expansion by $60 billion a month.
Also, the rhetoric went from a posture that proclaimed detachment to one that suggested to investors the central bank would be there to assist them each step of the way. Meanwhile, the widely-shared view on Wall Street is that market expectations are just too high to be disappointed.
The STOXX 600 was flat even as most car companies—with the notable exception of Renault (PA:RENA)—jumped after PSA Group (PA:PEUP) and Fiat Chrysler Automobiles (MI:FCHA) announced they’re negotiating their merger, which is set to create an auto powerhouse worth $49 billion in market capitalization.
In the earlier Asian session, all major regional indices slipped into red territory after some media firms and technology companies posted weak earnings results. The current market’s biggest driver, trade, didn’t help either, as news reports suggested that the U.S. and China may fail to sign a deal next month—something that investors have largely priced in by this stage—amid some key resurfacing sticking points
Global Financial Affairs
On Tuesday, U.S. shares edged lower on all major indices except the Russell 2000. The S&P 500 and the NASDAQ 100 retreated from their fresh record highs, after Alphabet (NASDAQ:GOOGL) missed estimates, dragging down tech stocks. Google's parent company posted a 23% profit loss due to rising costs, sending the group's shares over 4% lower after market close.
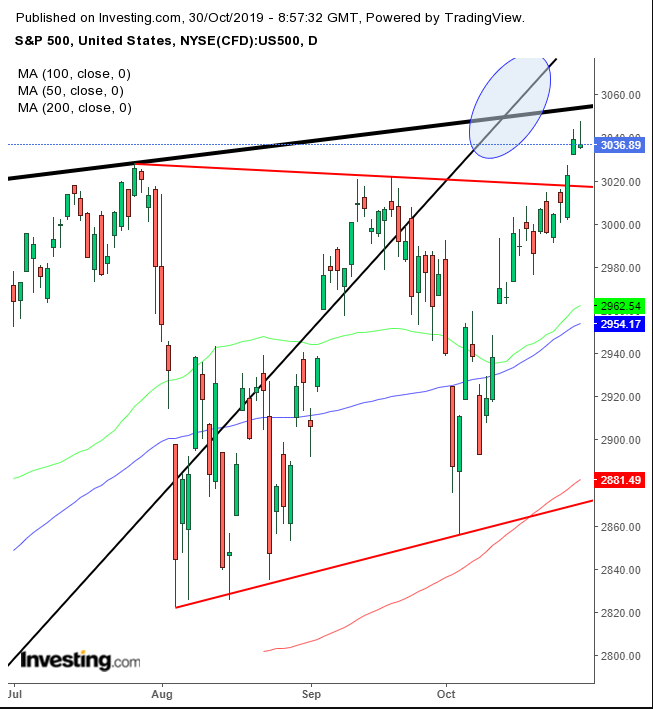
The SPX initially extended its all-time high but closed lower, registering a shooting star and adding to evidence of a potential selloff.
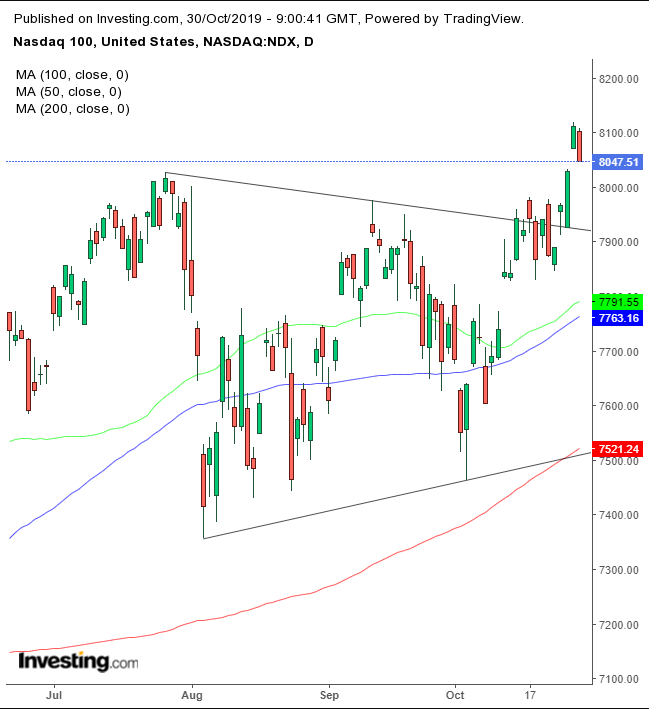
Meanwhile, trading on the NASDAQ completed a bearish engulfing pattern, which suggests a return move to a bullish triangle. Unlike the S&P 500, however, there are no bearish technicals that weigh on the tech-heavy index’s outlook.
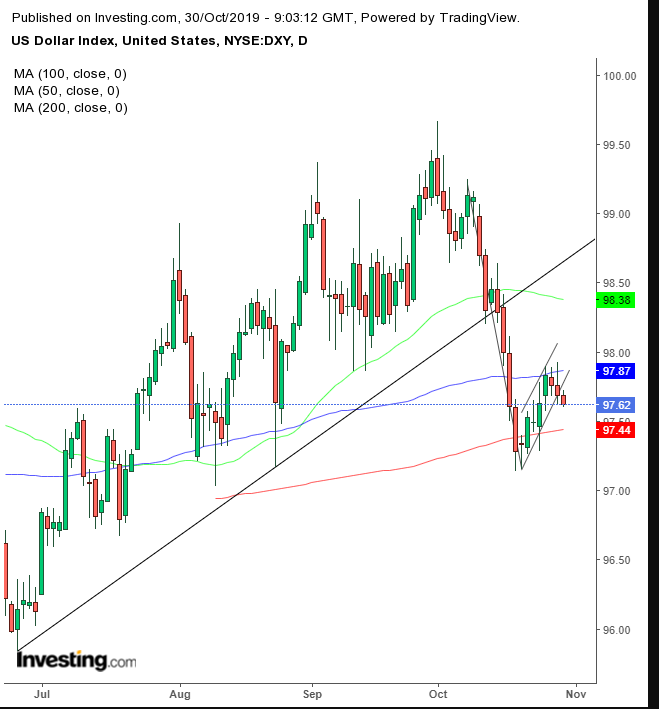
Yields on 10-year Treasurys fell, and the dollar sold off for the third straight day, possibly completing a rising flag—bearish after the 2.00% drop from Oct. 8 to Oct. 18. A bearish outlook would jibe with the Dollar Index’s slide below its uptrend line since late June.
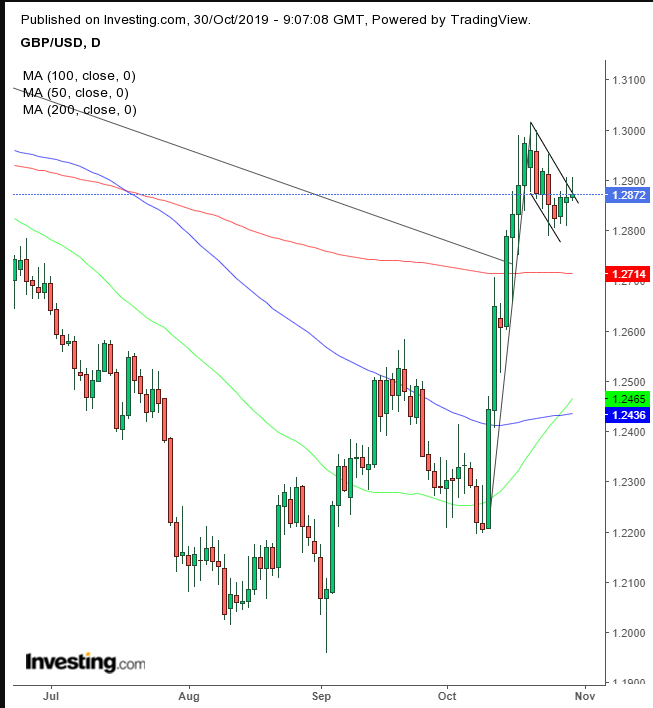
In a mirror image, the pound rose for the third day after U.K. Prime Minister Boris Johnson won backing from Parliament for a Dec. 12 election. Technically, cable may be completing a falling flag, bullish following the 6.6% surge from Oct. 10 to Oct. 21. This bullish outlook jibes with the fact the currency crossed above both its downtrend since April 2018 and its 200 DMA.
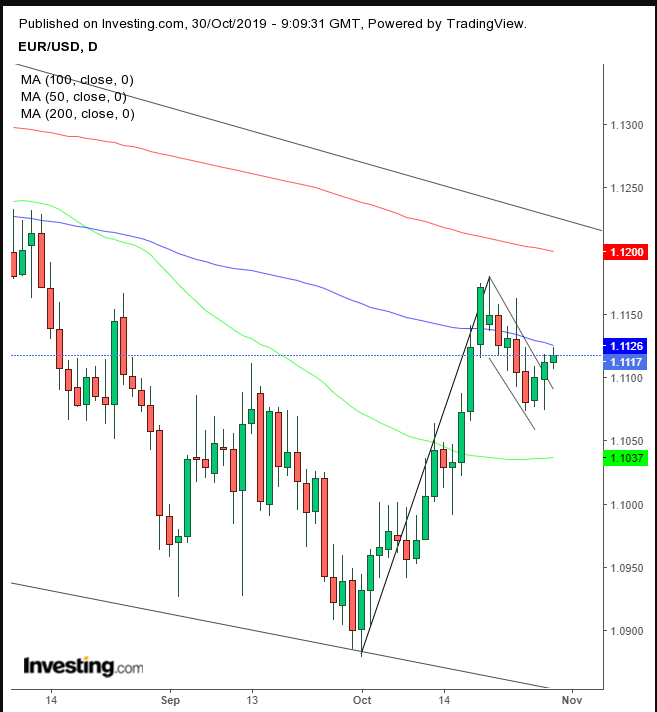
The euro was steady after data showed France’s economy grew more than expected in the third quarter. Technically, the euro may have completed a falling flag, like the pound, but its 200 DMA and downtrend line since September 2018 remain above that mark.
In the commodities market, oil retrenched for the third consecutive session on resurgent trade worries.
Bitcoin also slid, consolidating for the fourth day at a be-or-die technical level.
Up Ahead
- Earnings report coming up this week include: Facebook (NASDAQ:FB)—where the effect of a profit beat could offset regulatory risk on the stock price—Airbus (PA:AIR), Apple (NASDAQ:AAPL), Exxon Mobil (NYSE:XOM), PetroChina (NYSE:PTR), Credit Suisse (SIX:CSGN) and Macquarie Group (ASX:MQG).
- The Federal Reserve is expected to lower the main interest rate on Wednesday.
- U.S. economic growth slowed to 1.6% in the third quarter, GDP data is expected to show on Wednesday.
- The Bank of Japan sets policy on Thursday, with Governor Haruhiko Kuroda holding a news conference after the monetary decision.
- Monthly U.S. nonfarm payrolls numbers come up on Friday.
Market Moves
Stocks
Currencies
Bonds
Commodities
