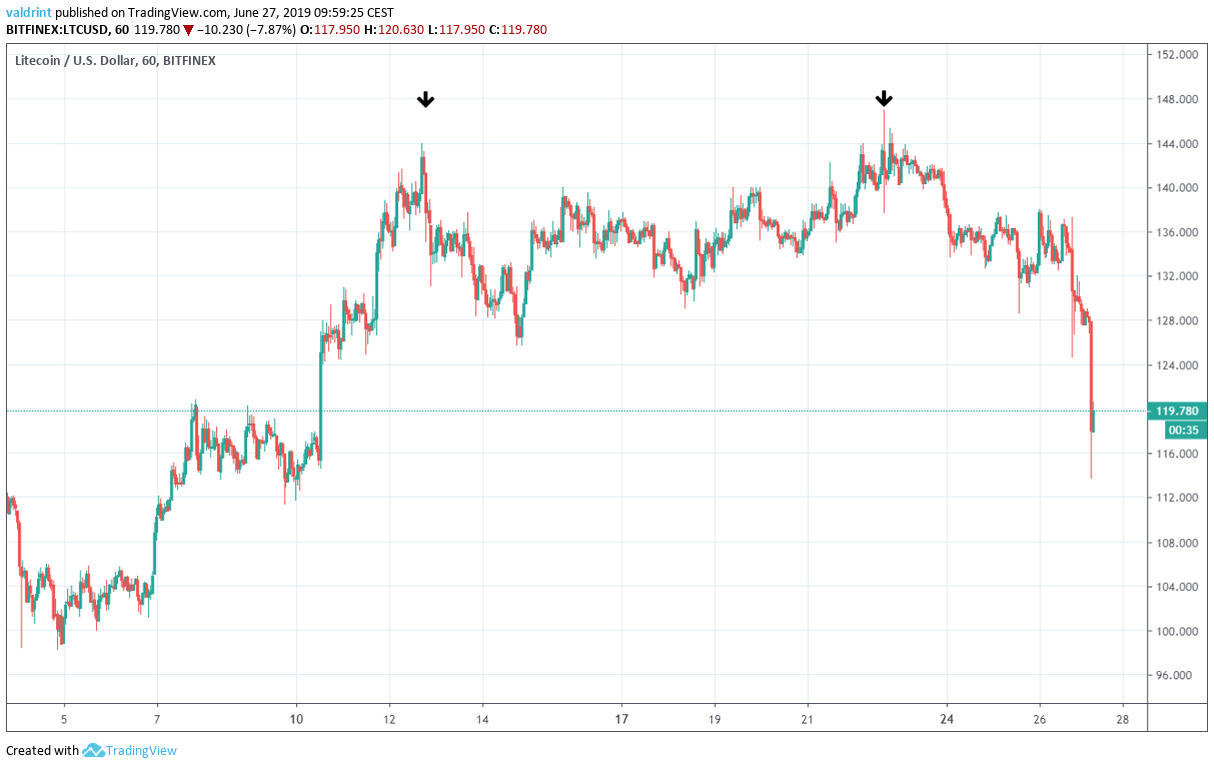
The Litecoin price has been increasing since June 5, 2019. On June 12, it reached highs close to $144. After a gradual decrease, similar levels were reached on June 22.
Since then, the Litecoin price has been decreasing. This decrease intensified on June 26.
Where will the price go to next? Let’s find out.
Litecoin Price: Trends and Highlights for June 27
- The Litecoin price made a double top on June 13 and 22.
- It is trading inside an ascending wedge.
- The daily moving averages are close to making a bearish cross.
- The next support level is found at $100.
LTC Price in an Ascending Wedge
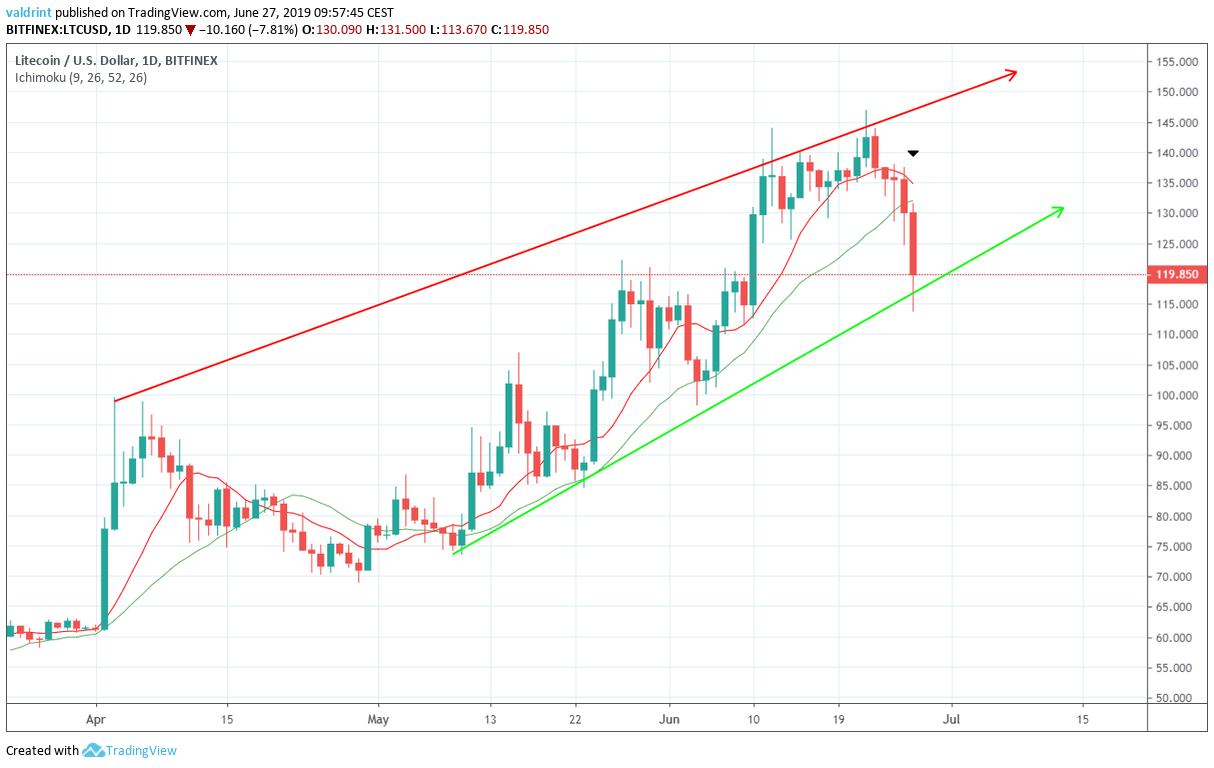
The price of LTC is analyzed at daily intervals from Apr 1 to June 27. The 10- and 20-day moving averages (MA) are added to the second graph.
Since reaching highs near $100 on Apr 3, the Litecoin price has been trading inside the ascending wedge outlined below.
The ascending wedge is a bearish pattern, making a price breakdown more likely.
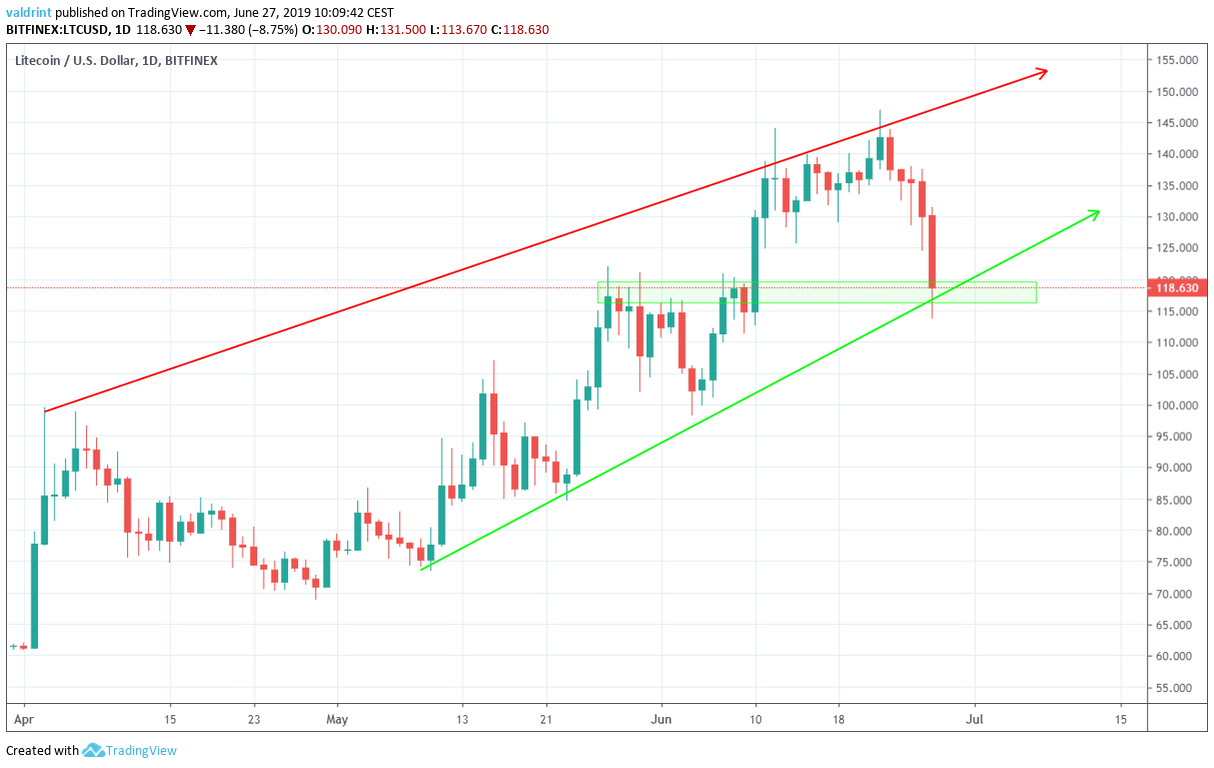
The Litecoin price touched the wedge’s resistance line on June 22, before initiating a downward move. It dropped to the support line within a span of five days.
At the time of writing, it was trading at $118, inside a support area created by the highs reached at the end of May and right on the ascending support line.
The aforementioned decrease has caused the LTC price to decrease below both the 10- and 20-day moving averages.

Furthermore, the MAs are very close to making a bearish cross. A cross between the 10- and 20-day MAs has not occurred since Apr 20.
The past five daily candles have been bearish.
Today’s candle is shaping up to be a bearish engulfing candle, a sign that would support further price decreases, especially if the price closes below the ascending support line.
If the price bounces on the line and begins a short-term increase, it is likely to face resistance from the MAs.
Looking For Support
As stated above, the Litecoin price is currently at the support line of the wedge.

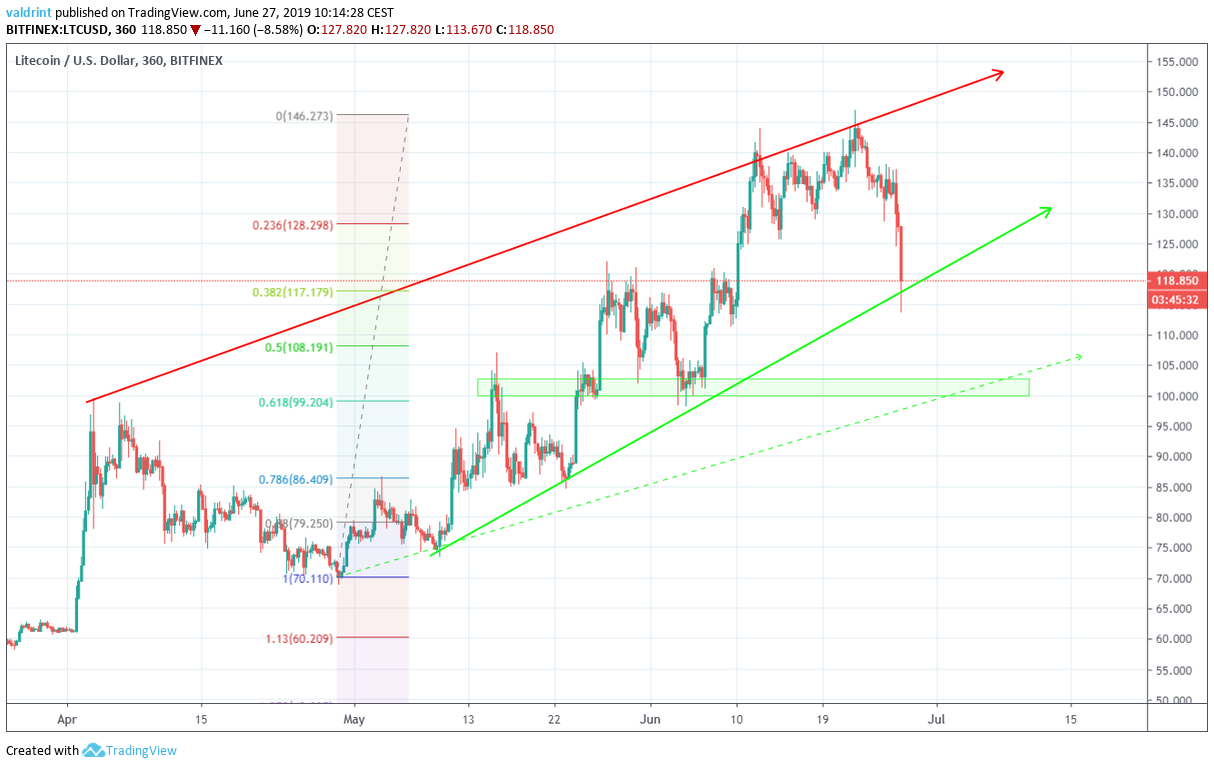
If the line is not effective in supporting the price, the next support level would be found near $100.
This level coincides with the highs of May 14 and the 0.618 fib level of the entire movement.
A drop towards it would invalidate the ascending wedge pattern and likely create an ascending channel, outlined by the green dashed line.
Also, if the LTC price instead continues to increase inside the confines of the wedge, it is still possible that a breakdown will follow. In this scenario, however, depending on when the breakdown occurs, the most likely support area could instead be $108 — found by the 0.5 fib level and the dashed ascending support line after July 15.
Summary
The price of LTC has been trading inside an ascending wedge since the beginning of April.
It is currently trading on the support line of the wedge, facing resistance from the 10- and 20-day MAs.
If the Litecoin price breaks down from the wedge, it is likely to find support near $100 and create an ascending channel.

