A reverse head and shoulders pattern is forming in the short term on the NZD/USD H4 chart, which could lead the pair up in the short term.
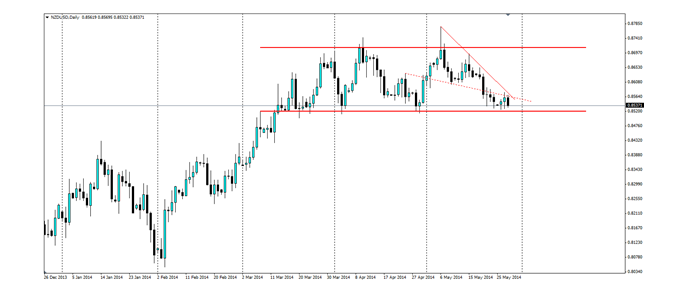
The channel on the NZD/USD D1 chart has formed with the top of 0.8712 proving tough to break convincingly. Similarly, the market sees the kiwi under 0.8520 as being undervalued so the support has also proved tough to break. The Rejection off the peak at 0.8777 formed a false breakout and led to the current bearish trend line; which has its roots in recent news events and a change in economic sentiment.

There has been some positive economic news out of the US, such as Durable Goods Orders, which were up 0.8% versus an expected fall off -0.5%. Employment figures have been looking good for the US in the last couple of months and new home sales figures are also pointing in the right direction. For the Kiwi dollar, falling commodity prices, particularly dairy prices, have driven the kiwi off its peak of 0.8777 and continue to be a source of concern.
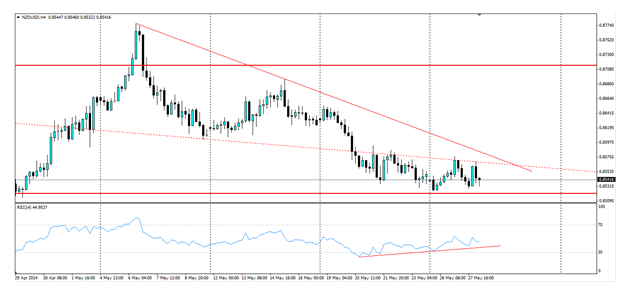
If we look at the shorter time frame charts we can see an interesting reverse head and shoulders pattern forming at the bottom of the current bearish trend. The below NZD/USD H4 chart shows the dotted red line as the neckline of the set up, with the bottom of the “head” very close to the bottom line of the channel.

The RSI on the NZD/USD H4 chart also looks to support a breakout of the neckline as it is posting higher lows, showing the momentum moving up to the bullish side. This is diverging from the actual price movement, further supporting a potential reversal.
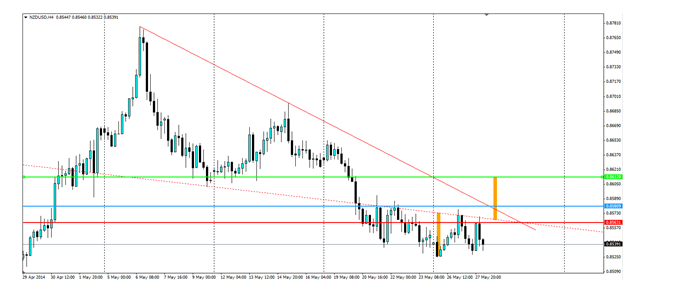
A trading set up looking to take advantage of this would look for the bearish trend to break down along with the neckline. Look to enter the trade once the break out has been confirmed, possibly around the 0.8580 mark. A stop loss should be set back inside the neck line to protect against any false breakout.
A target for this action would be at the same distance above the neckline as the bottom is below. For instance, the bottom of the “head” is roughly 48 pips below the neckline as shown by the orange triangle. Consequently, our first price target should be 48 pips above the neckline, or around the 0.8612 mark which coincides with a level of support found as the price was falling.

The NZD/USD looks to have formed a reverse head and shoulders which could provide a breakout of the neck line in the short term.
