


Sign up to create alerts for Instruments,
Economic Events and content by followed authors
Free Sign Up Already have an account? Sign In
Please try another search

Machinery company Nordson Corporation (NASDAQ:NDSN) reported impressive results for fourth-quarter fiscal 2017 (ended Oct 31, 2017).
Adjusted earnings came in at $1.38 per share, topping the Zacks Consensus Estimate of $1.32 by 4.5%. This was the company’s eighth consecutive quarter of reporting better-than-expected bottom-line results. On a year-over-year basis, the company’s earnings decreased by 1 cent or 0.7%.
For fiscal 2017, Nordson’s adjusted earnings per share were $5.37, beating the Zacks Consensus Estimate of $5.32 by 0.9% and increasing 14.7% from the year-ago tally of $4.68.
Organic Volume & Acquisition Gains Drive Revenues
Nordson’s net sales in the fiscal fourth quarter totaled $573.9 million, increasing 12.7% year over year. The improvement was driven by 2% increase in organic volume, 10% gain from acquired assets and 1% positive impact of currency translation. Also, the top line surpassed the Zacks Consensus Estimate of $543 million by 5.7%.
Backlog was $402 million, up 45% year over year. Orders for the 12-week period ended Aug 13, decreased 2% year over year.
On a regional basis, revenues sourced from the United States grew 24.2% year over year. Businesses in Japan, the Americas and Europe also improved, recording revenue increase of 31.7%, 15.4% and 15.2%, respectively. Top-line results in Asia Pacific declined 5.1%.
The company reports its top-line results under three segments, namely, Adhesive Dispensing Systems, Advanced Technology Systems and Industrial Coating Systems. A brief discussion on the segmental performance in the fiscal fourth quarter is provided below:
Adhesive Dispensing Systems segment’s revenues totaled $247.9 million, increasing 5.8% year over year. Results were driven by 4% organic growth and 2% forex gains.
Advanced Technology Systems revenues were $251.7 million, up 29.4% year over year on the back of 4% organic volume growth and 25% gains from acquired assets. Product demand was strong in the electronics end markets of this segment.
Revenues generated from Industrial coating systems fell 7.6% to $74.3 million.
For fiscal 2017, the company’s net sales were $2,067 million, increasing 14.3% year over year. Results were driven by 14.8% volume growth, partially offset by 0.5% negative impact of currency translation. Also, the top line beat the Zacks Consensus Estimate of $2.04 billion.
Margin Suffers From Higher Costs & Expenses
Nordson’s margin profile in the quarter suffered due to rise in cost of sales and operating expenses. Cost of sales increased 11.8% year over year, representing 45.6% of net sales compared with 46% in the year-ago quarter. Selling and administrative expenses, as a percentage of net sales, were 32.6% compared with 32.2% in the year-ago quarter.
Adjusted earnings before interest, tax, depreciation and amortization (EBITDA) in the quarter were $149.8 million, increasing 16.4% year over year. Operating profits grew 12.6% year over year while the margin came in at 21.7% versus 21.8% in the year-ago quarter.
Balance Sheet & Cash Flow
Exiting the fiscal fourth quarter, Nordson’s cash and marketable securities were $90.4 million, down from $110.7 million in the previous-quarter end. The company’s long-term debt was $1,256.4 million, below $1,569.7 million exiting the previous quarter.
In the quarter, the company generated net cash of $133.5 million from its operating activities, decreasing 2.2% year over year. Capital spent on addition of property, plant and equipment grew 44.4% to $22.2 million. During the quarter, the company paid dividends of approximately $17.3 million to its shareholders.
Outlook
For first-quarter fiscal 2018, Nordson anticipates sales to increase in the range of 30-34% year over year. Organic volume growth is predicted to increase 15-19%. Acquisition gains will likely lead to 11% sales growth while foreign currency movements will add 4%. Operating margin will likely be 22%. EBITDA is expected to be within $141-$150 million.
GAAP earnings are expected in the range of $1.29-$1.39 per share, including 7 cents of expenses related to acquisition intangible asset amortization.
The company believes that fiscal first-quarter results will benefit from healthy product demand in the electronics and medical end markets of the Advanced Technology segment.
Nordson Corporation Price and Consensus
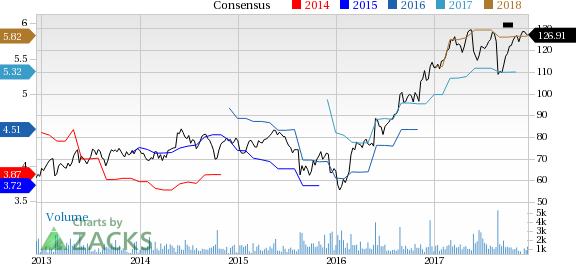
Nordson Corporation Price and Consensus | Nordson Corporation Quote
Zacks Rank and Key Picks
With a $7.3 billion market capitalization, Nordson currently carries a Zacks Rank #3 (Hold). Better-ranked stocks in the industry include Kadant Inc. (NYSE:KAI) , Sun Hydraulics Corporation (NASDAQ:SNHY) and Applied Industrial Technologies, Inc. (NYSE:AIT) . While Kadant and Sun Hydraulics sport a Zacks Rank #1 (Strong Buy), Applied Industrial carries a Zacks Rank #2 (Buy). You can see the complete list of today’s Zacks #1 Rank stocks here.
Kadant pulled off an average positive earnings surprise of 20.32% in the last four quarters. Also, earnings estimates for 2017 and 2018 were revised upward in the last 60 days.
Sun Hydraulics delivered an average positive earnings surprise of 9.58% in the trailing four quarters. Also, bottom-line expectations for 2017 and 2018 improved over the past 60 days.
Applied Industrial’s financial performance was impressive, with an average positive earnings surprise of 9.71% in the last four quarters. Also, earnings estimates for fiscal 2018 and fiscal 2019 were revised upward over the last 60 days.
Zacks Editor-in-Chief Goes "All In" on This Stock
Full disclosure, Kevin Matras now has more of his own money in one particular stock than in any other. He believes in its short-term profit potential and also in its prospects to more than double by 2019. Today he reveals and explains his surprising move in a new Special Report.
Download it free >>
Nvidia’s muted reaction keeps tech on edge, with chipmakers in focus. Nasdaq’s 20980-21000 support holds—for now. A break could mean trouble. With Nvidia done, GDP today and...
Nvidia’s earnings beat didn’t erase investor concerns over slowing growth. Soft Q1 guidance and valuation worries may limit the stock’s upside. Weak network and gaming sales...
Shares of Etsy (NASDAQ:ETSY) are down approximately 7% since the company reported earnings on February 19. Concerns over slowing growth are overriding revenue and earnings that...
Are you sure you want to block %USER_NAME%?
By doing so, you and %USER_NAME% will not be able to see any of each other's Investing.com's posts.
%USER_NAME% was successfully added to your Block List
Since you’ve just unblocked this person, you must wait 48 hours before renewing the block.
I feel that this comment is:
Thank You!
Your report has been sent to our moderators for review
Add a Comment
We encourage you to use comments to engage with other users, share your perspective and ask questions of authors and each other. However, in order to maintain the high level of discourse we’ve all come to value and expect, please keep the following criteria in mind:
Enrich the conversation, don’t trash it.
Stay focused and on track. Only post material that’s relevant to the topic being discussed.
Be respectful. Even negative opinions can be framed positively and diplomatically. Avoid profanity, slander or personal attacks directed at an author or another user. Racism, sexism and other forms of discrimination will not be tolerated.
Perpetrators of spam or abuse will be deleted from the site and prohibited from future registration at Investing.com’s discretion.