Nikkei Bears Only Getting Warmed Up

Published 03/06/2018, 04:48 AM
Updated 07/09/2023, 06:31 AM

The last time we wrote about the Japanese Nikkei 225 index was October 18th, 2017. While the price was hovering around 21 360, the weekly chart of the benchmark allowed us to recognize a worrisome Elliott Wave pattern, suggesting the bulls should be able “to reach 23 000 or maybe even 24 000“, but a major three-wave decline should then follow. Take a look at the chart below to refresh you memory.
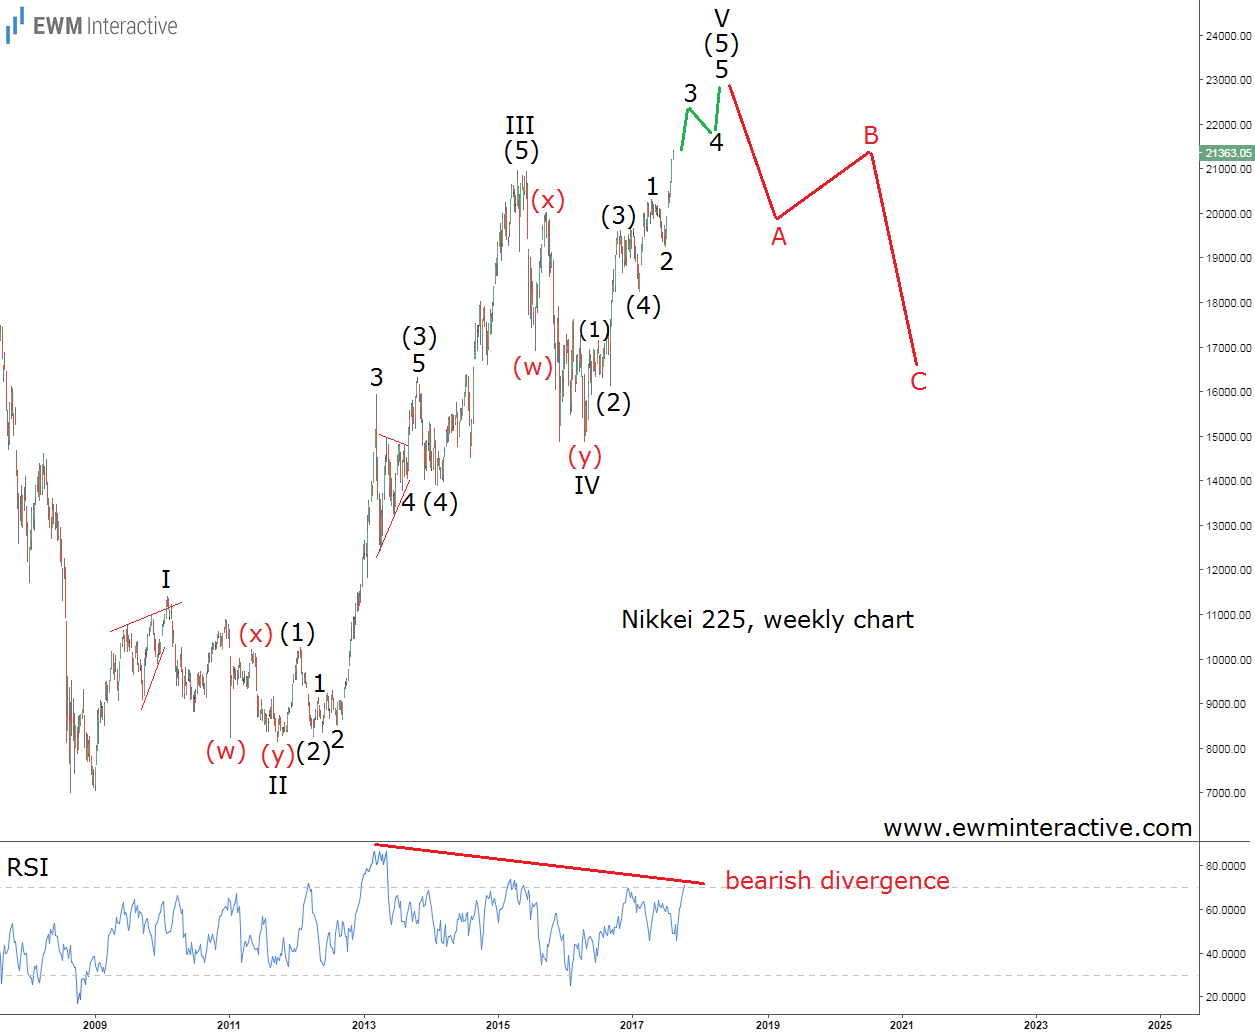
Nikkei 225 Elliott Wave Analysis

The pattern in question is called an impulse and the weekly chart of Nikkei 225 revealed that it has been developing since the March 2009 bottom at just under 7000. As visible, we thought wave V of the sequence was still in progress, but the bulls were definitely “Overstaying Their Welcome”. So instead of joining them, it made sense to simply stay aside and prepare for a bearish reversal once they run out of steam. A bearish divergence between the price and the Relative Strength Index further reinforced the negative outlook. Four and a half months later, here is an updated chart of the Nikkei 225.
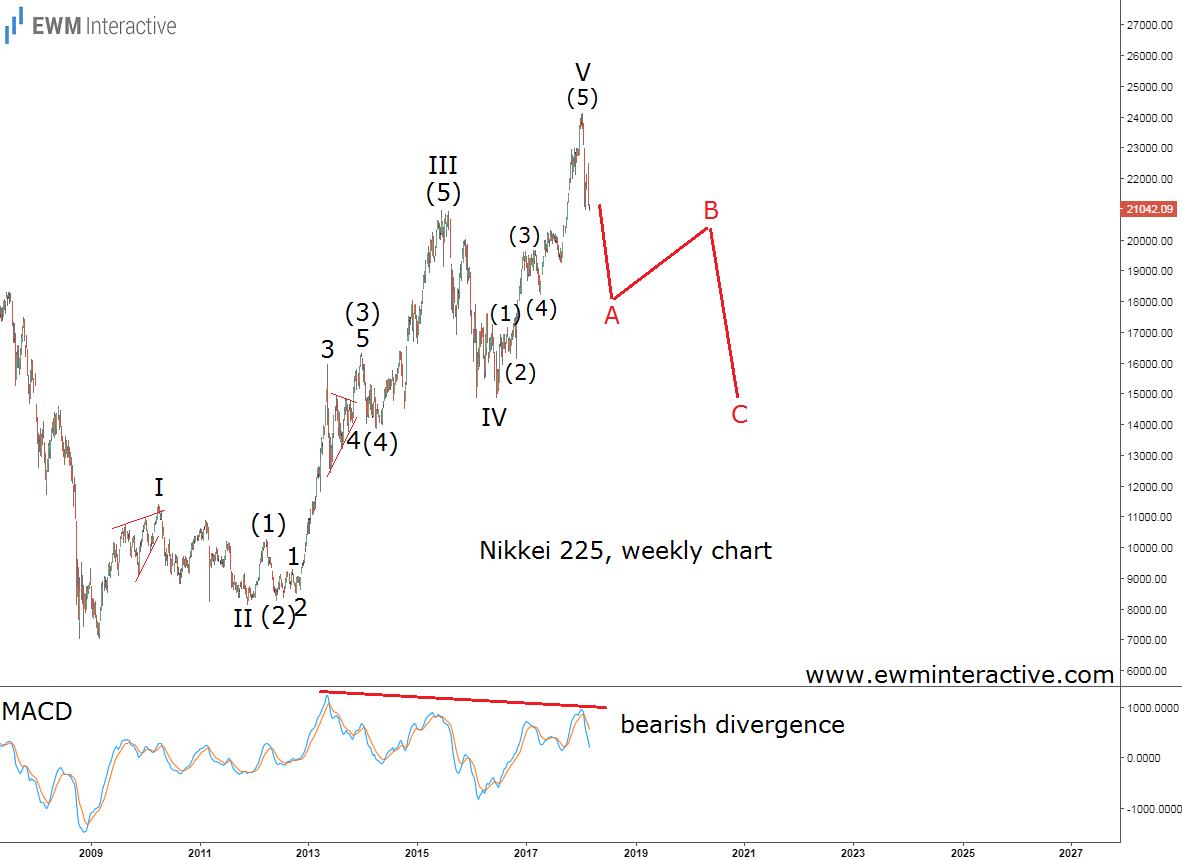
Nikkei 225 Elliott Wave Analysis Update

The bulls could only defy gravity until they climbed to 24 129 on January 23rd, 2018, where wave (5) of V appears to have ended. The following 3100-point selloff breached the 21 000 mark, dragging the Nikkei 225 to as low as 20 937 by March 5th. The bad news is we do not think the bloodbath is over yet. In fact, we believe the bears are only getting warmed up.

If this count is correct, the post-2009 bull market is finally over and a major three-wave decline to the support area of wave IV should be expected from now on. This means the Nikkei 225 could lose another 6000 points from current levels. The MACD indicator seems to be in overbought territory, as well, and the bearish divergence we already mentioned still persists. In our opinion, it is too early to buy this dip.

Original post

Latest comments

Loading next article…
Risk Disclosure: Trading in financial instruments and/or cryptocurrencies involves high risks including the risk of losing some, or all, of your investment amount, and may not be suitable for all investors. Prices of cryptocurrencies are extremely volatile and may be affected by external factors such as financial, regulatory or political events. Trading on margin increases the financial risks.
Before deciding to trade in financial instrument or cryptocurrencies you should be fully informed of the risks and costs associated with trading the financial markets, carefully consider your investment objectives, level of experience, and risk appetite, and seek professional advice where needed.
Fusion Media would like to remind you that the data contained in this website is not necessarily real-time nor accurate. The data and prices on the website are not necessarily provided by any market or exchange, but may be provided by market makers, and so prices may not be accurate and may differ from the actual price at any given market, meaning prices are indicative and not appropriate for trading purposes. Fusion Media and any provider of the data contained in this website will not accept liability for any loss or damage as a result of your trading, or your reliance on the information contained within this website.
It is prohibited to use, store, reproduce, display, modify, transmit or distribute the data contained in this website without the explicit prior written permission of Fusion Media and/or the data provider. All intellectual property rights are reserved by the providers and/or the exchange providing the data contained in this website.
Fusion Media may be compensated by the advertisers that appear on the website, based on your interaction with the advertisements or advertisers.
© 2007-2025 - Fusion Media Limited. All Rights Reserved.