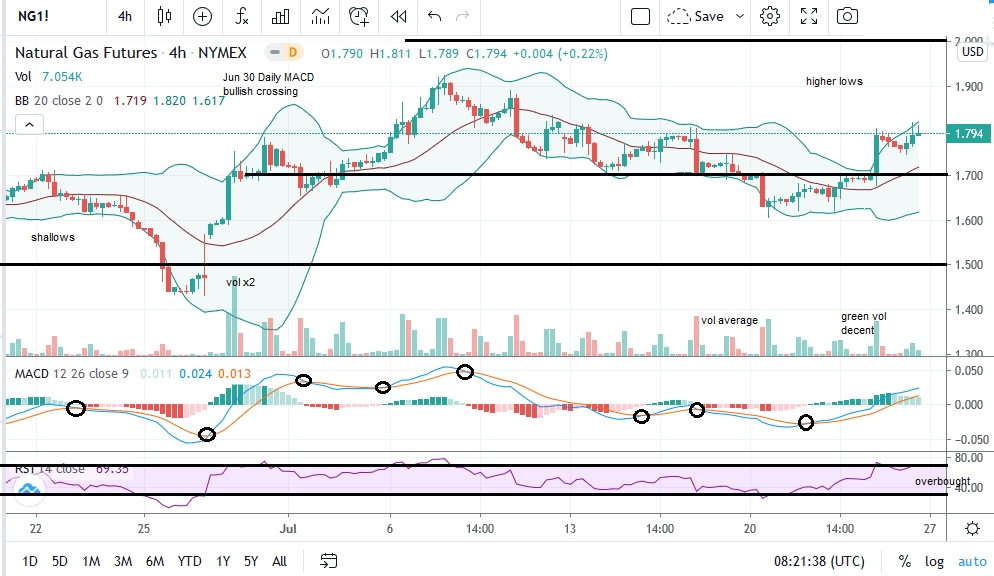
Natural Gas futures on the Nymex had a volatile week before closing on Friday 5.2% higher than a week ago at $1.79. EIA confirmed on Thursday a build of only 37 Bcf in working underground stocks which is bullish for a week ending July 17. Inventory currently 25.6% higher y/y, 15.7% above the 5-year average. Both percentages were coming down steadily in the past 3 months despite that the average rate of injections into storage remains 12% higher than the 5-year average so far in the refill season. EIA expects the percentage to be well down compared to 2019, at the start of the withdrawal season in November.
Here we are in the middle of the summer, with the September contract currently trading at $1.85. January showing weakness lately trading at $2.89. We are buyers since we have identified a floor amid the coronavirus crisis and the post-winter downtrend. We have no intention to follow negative moves for the months to come. Buying the near term charts on momentum is what we like to do, any dip and pullback is to be bought early so we can follow the uptrend on seasonality and be profitable multiple times from the same ranges. We first need to clear $1.70 - $1.80, an area that has been offering support and we need to see new higher lows with the October contract. This move will cement further the overall sentiment and will offer hedging opportunities for many market participants as the price on supply and demand showed extraordinary stability during the crisis and it is showing more strength during the industry's ongoing consolidation. $2.50 must now be considered attainable for winter contracts.
The coronavirus concerns, however, will be very much alive for at least another quarter. Although U.S. housing data are showing promise lately, the service sector is failing to recover fast enough and the consumer sentiment remains negative as initial jobless claims rose for the first time in four months. U.S. macro data and the Dollar Index to be routinely monitored. Daily, 4hour, 15min MACD and RSI pointing entry areas. 
- English (UK)
- English (India)
- English (Canada)
- English (Australia)
- English (South Africa)
- English (Philippines)
- English (Nigeria)
- Deutsch
- Español (España)
- Español (México)
- Français
- Italiano
- Nederlands
- Português (Portugal)
- Polski
- Português (Brasil)
- Русский
- Türkçe
- العربية
- Ελληνικά
- Svenska
- Suomi
- עברית
- 日本語
- 한국어
- 简体中文
- 繁體中文
- Bahasa Indonesia
- Bahasa Melayu
- ไทย
- Tiếng Việt
- हिंदी
Natural Gas Higher Support In Sight
Published 07/26/2020, 06:07 AM
Updated 07/09/2023, 06:32 AM
Natural Gas Higher Support In Sight
Latest comments
Loading next article…
Install Our App
Risk Disclosure: Trading in financial instruments and/or cryptocurrencies involves high risks including the risk of losing some, or all, of your investment amount, and may not be suitable for all investors. Prices of cryptocurrencies are extremely volatile and may be affected by external factors such as financial, regulatory or political events. Trading on margin increases the financial risks.
Before deciding to trade in financial instrument or cryptocurrencies you should be fully informed of the risks and costs associated with trading the financial markets, carefully consider your investment objectives, level of experience, and risk appetite, and seek professional advice where needed.
Fusion Media would like to remind you that the data contained in this website is not necessarily real-time nor accurate. The data and prices on the website are not necessarily provided by any market or exchange, but may be provided by market makers, and so prices may not be accurate and may differ from the actual price at any given market, meaning prices are indicative and not appropriate for trading purposes. Fusion Media and any provider of the data contained in this website will not accept liability for any loss or damage as a result of your trading, or your reliance on the information contained within this website.
It is prohibited to use, store, reproduce, display, modify, transmit or distribute the data contained in this website without the explicit prior written permission of Fusion Media and/or the data provider. All intellectual property rights are reserved by the providers and/or the exchange providing the data contained in this website.
Fusion Media may be compensated by the advertisers that appear on the website, based on your interaction with the advertisements or advertisers.
© 2007-2025 - Fusion Media Limited. All Rights Reserved.
