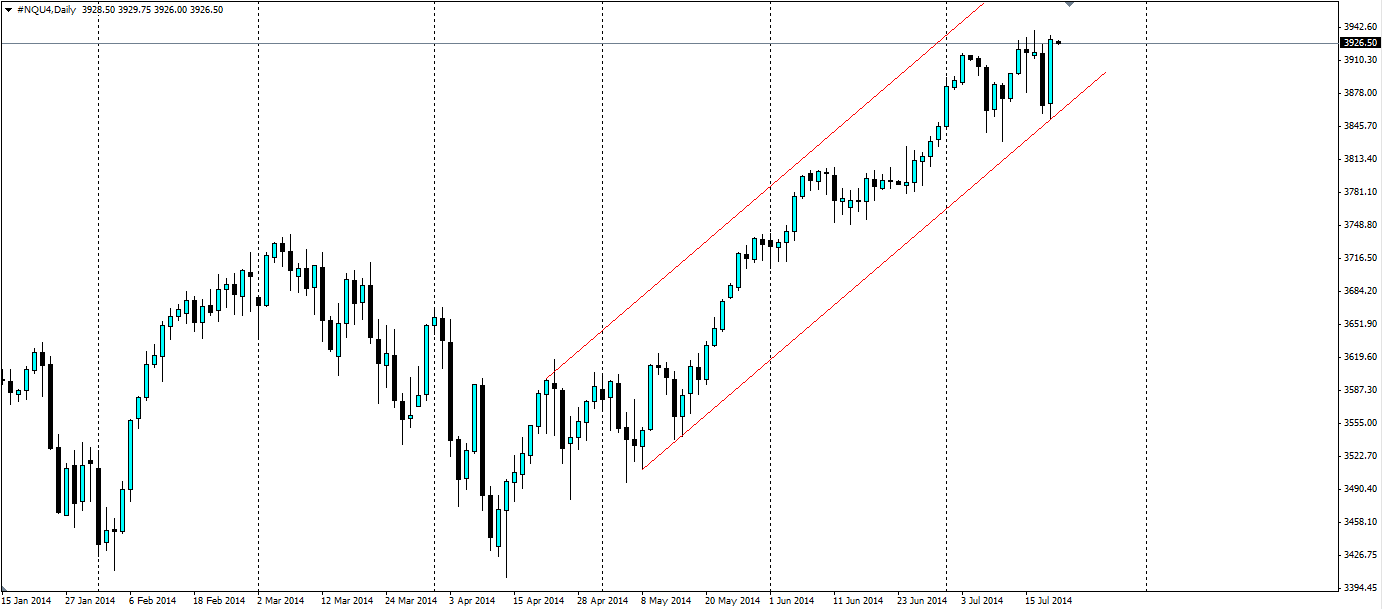
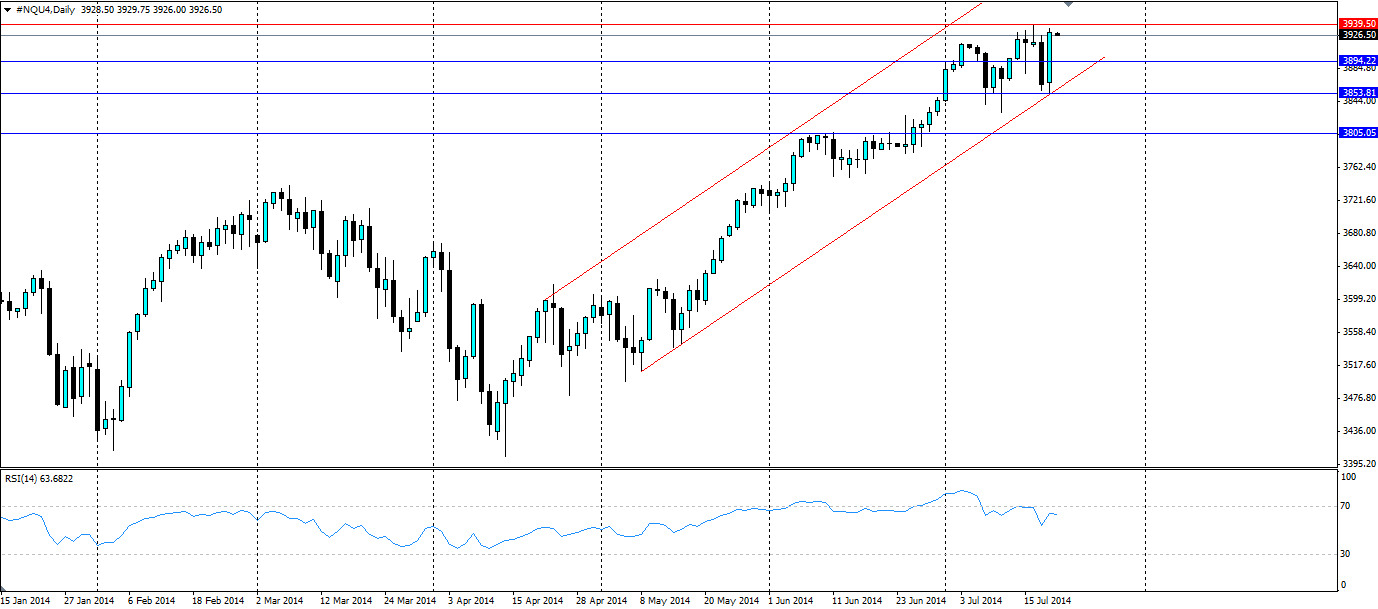
The NASDAQ Index took a big bounce off the bullish trend line as the end of last week. It has met some resistance at the current highs, however, if this breaks we will see a movement much higher and a continuation of the channel.

The NASDAQ has generally been more volatile than the leading US stock indices such as the Dow Jones and S&P 500, however, it is closely correlated with the two, therefore is affected by the broader economic sentiment in the same way. For these reasons it would pay to keep an eye on the US economic data that is due out this week. CPI figures will add to volatility and this should have the biggest impact of the NASDAQ as it is the riskier of the US Indices.
Unemployment Claims will have an effect on consumer products and the NASDAQ as this reflects how many people have disposable income. The US economy as a whole is looking more solid. The Job market is certainly showing positive signs and US Federal Reserve Chairwoman Janet Yellen shows confidence and believes interest rates could rise sooner rather than later. She has said an accommodating Monetary Policy is still necessary, hence the bullish trend in equities, and her confidence in the labour market has helped.
The end of last week saw a big day of selling off following the shooting down of Malaysian Airlines flight MH17. The threat of an escalation in tensions between the West and Russia led many traders to seek the safety of the assets such as gold. The invasion of Gaza by Israel also added to the Nasdaq’s worst day in three months. But the next day saw a big bullish engulfing candle on the chart as many trades poured back in and the index bounced off the trend line. The index was boosted by earnings announcements from many companies on Wall Street.

The RSI is showing some interesting divergence. The highs in the price have been higher throughout the month, however the RSI has been posting lower highs. This could signal a reversal in the trend, however, if the resistance at 3939.50 breaks, we should see a strong movement higher and the RSI will no doubt follow.
If the price does move lower, support can be found at 3894.22, 3853.81 and 3805.05, however the trend line is likely to act as dynamic support and could be a pivot point for a reversal and a move higher. Traders looking to follow the trend up should either look for a touch of the trend line, or for the resistance to break at 3939.50 before entering.
The NASDAQ Index recovered from a geopolitical shock at the end of last week and the bullish channel looks quite solid as a result. It will now need to test the resistance at the previous high before the trend can take the index any higher.
