This article was written exclusively for Investing.com
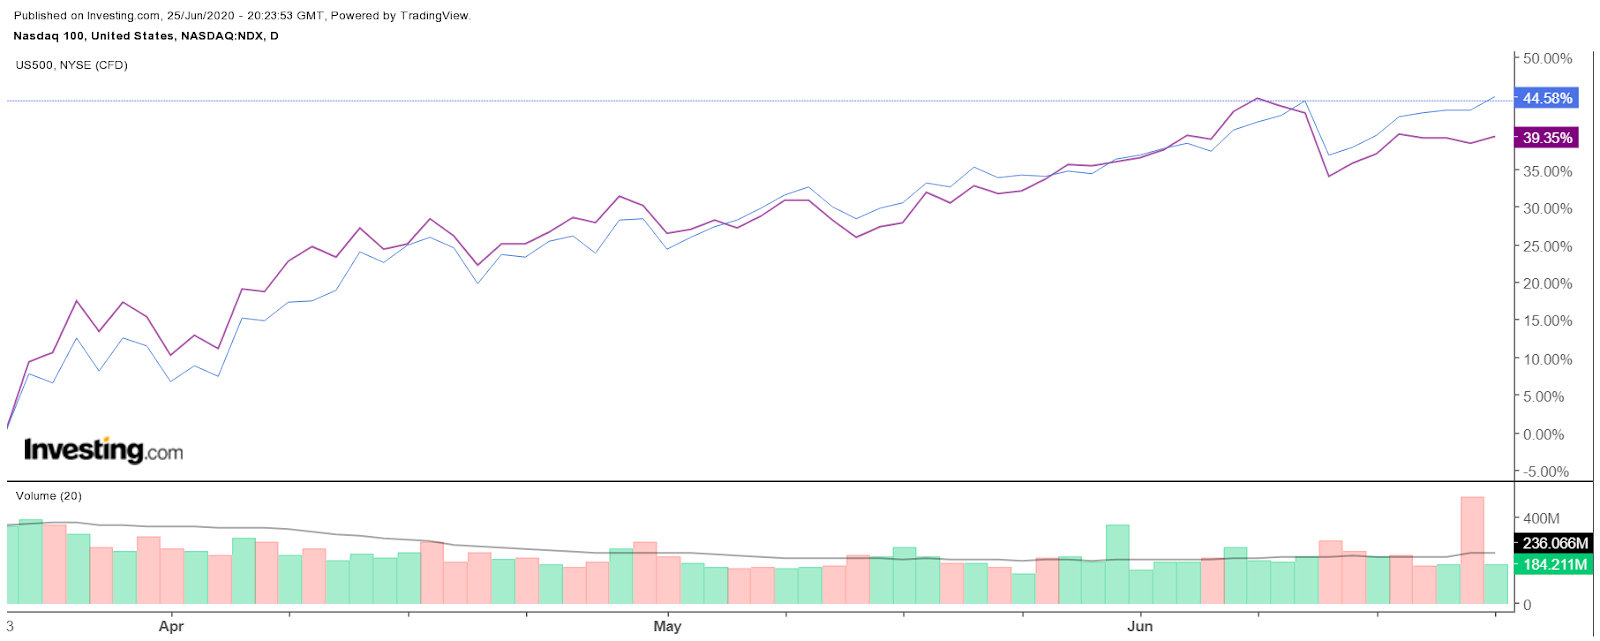
The NASDAQ 100 has been on a tear since March rising by a stunning 44.5%, easily outpacing the rebound in the S&P 500 of 39.4%. The significant outperformance is no surprise, given the technology-heavy DNA of the NASDAQ and how the "work-from-home" investment theme has been one of the hottest in recent memory.
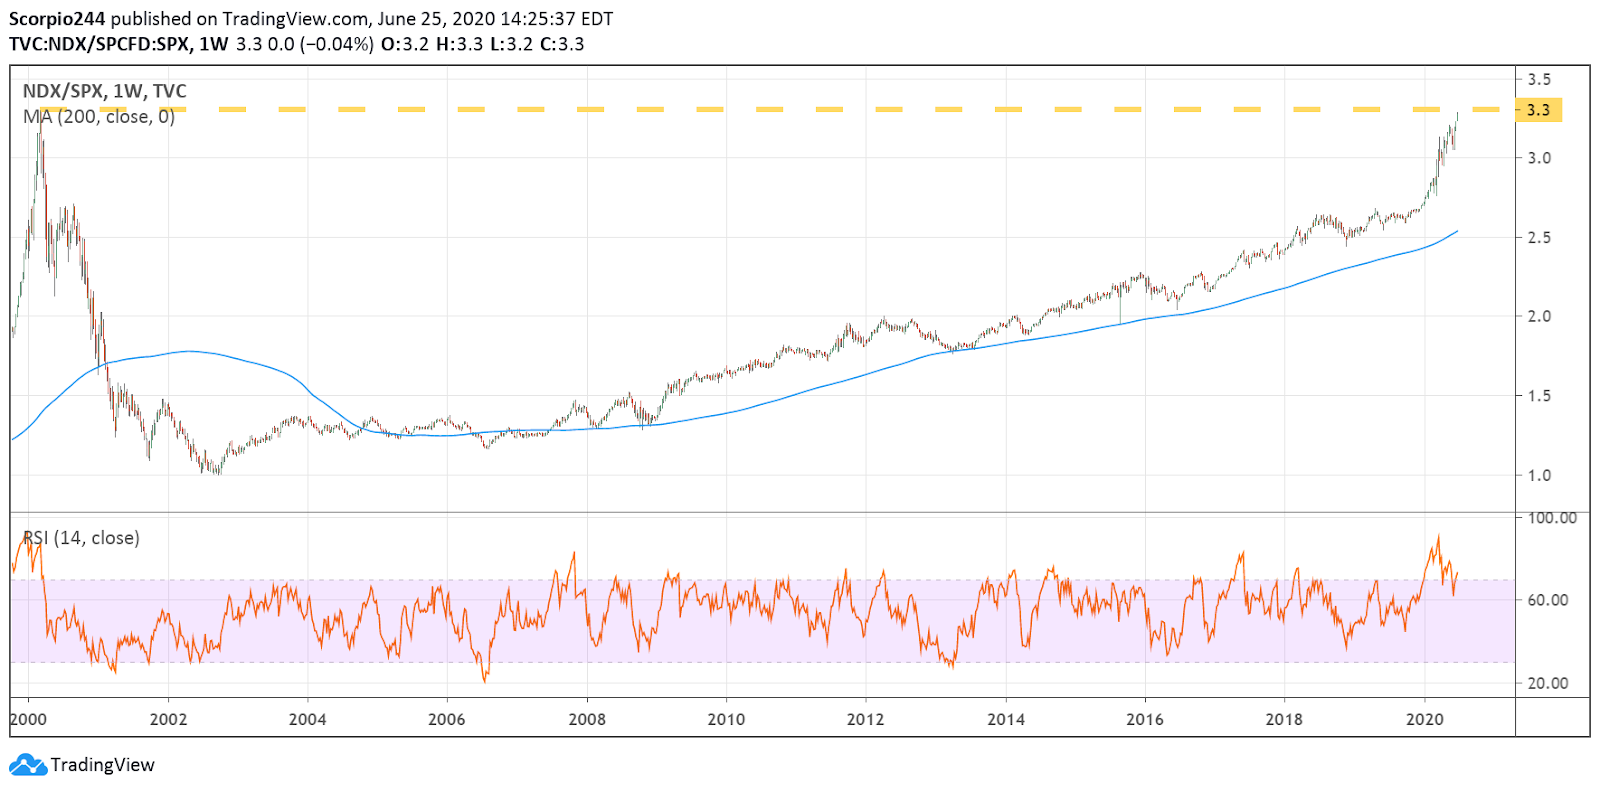
The big surge builds on a longer-term outperformance that has taken place over many years. But this boom has left the NASDAQ 100 in a precarious spot, valued at its highest level relative to the S&P 500 since the dot.com bubble of the late 1990s. It may be a sign of the times, and a glimpse into the future.

Big Outperformance
The NASDAQ 100 index is trading at just below 3.3 times the value of the S&P 500. The last time the index traded at this valuation versus the S&P 500 was on March 10, 2000, exactly two weeks before it all turned drastically south. The NASDAQ 100 ended up peaking at a record high on March 24, 2000, at 4,816, having gained over 300% in the preceding 18 months, while the S&P 500 also peaked on the same day, at 1,552.87, following a mere 53% increase. 
The years that followed with the bursting of the tech bubble were brutal for the NASDAQ 100, with massive declines the value of the index. This ratio collapsed back to 1 by October 2002 and it took the NDX another almost 17 years to regain that 2000 peak. It took the S&P 500 just 7 years to return to the highs of March 2000.
It is not to say that history is about to repeat itself with an imminent, gigantic collapse in the NASDAQ 100. However, it does demonstrate just how far the NASDAQ 100 has come, and how much it has accelerated since the start of 2020. In the period starting in 2018 through the end of 2019, the NASDAQ 100 traded for roughly 2.6 times the S&P 500. At the same ratio today, the NASDAQ 100 would be valued at just 8,015 or 20% less than its current value on at the close on Thursday, assuming the S&P 500 did not decline along with the NASDAQ.
On The Shoulders Of Technology Giants
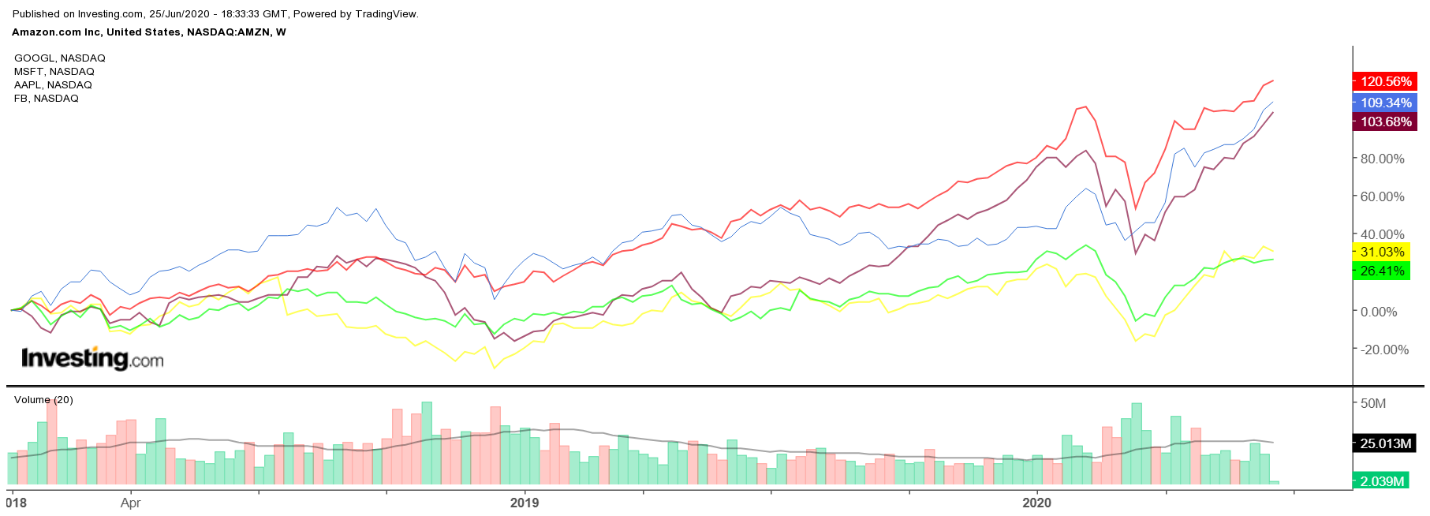
It is with good reason that the NASDAQ 100 has surged with companies like Apple (NASDAQ:AAPL), Microsoft (NASDAQ:MSFT), Amazon (NASDAQ:AMZN), Alphabet (NASDAQ:GOOGL), and Facebook (NASDAQ:FB) the largest by market cap, accounting for more than 40% of the index. Additionally, these five stocks account for about 20% of the S&P 500. It likely means that if the NASDAQ struggles in the future, the S&P 500 is likely to experience much of the same pain, due to the structure of the indexes themselves.

If the five big technology companies remain hot, it seems very likely that the NASDAQ 100 will continue to outperform the S&P 500, pushing that relative valuation even higher. If the stay-at-home trade should fade, or valuations become too stretched, investors may choose to begin to lock in profits. This could be the trigger that causes the NASDAQ to underperform the S&P 500 going forward.
It seems that much like the NASDAQ 100 has outperformed on the way up, it is likely to underperform on the way down. The big question is, if it does begin to underperform, what shape will a selloff be and how much pain will be involved in that process? One can only hope that history does not, indeed, repeat itself and that any selloff does not take on the same form as the one at the start of this century.
Disclaimer: Michael Kramer and the Clients of Mott Capital own AAPL, GOOGL, MSFT
