- All Instrument Types
- Indices
- Equities
- ETFs
- Funds
- Commodities
- Currencies
- Crypto
- Bonds
- Certificates
Please try another search

In Aggregate, American Housing Was Never Underwater

There’s been a kind of misleading chart circulating around the internet in the past few days, so I just wanted to take an opportunity to make a note of it here.
The chart, put together by The Economist, compares “owners’ equity” to “mortgage debt” and shows that the two are about to converge. The implication, which is inaccurate, is that this means that homeowners are no longer under water on their homes in aggregate. Even The Economist gets the interpretation wrong:
American homeowners are finally returning to positive equity. The calamitous financial situation of “negative equity” is when the mortgage on your house dwarves the value of the house itself. That has been the situation of American homeowners in aggregate since late 2007, according to “flow of funds” data from the US Federal Reserve. But this may be coming to an end, after 23 quarters.
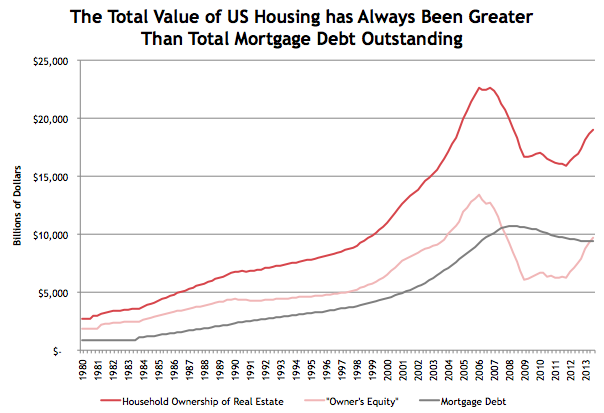
The chart is misleading though because in reality the value of US housing stock has never been less than the amount of debt owed on it. The “home equity” line shown in The Economist’s chart actually quantifies the amount that homeowners have been above water on their houses over time. Just like on a company balance sheet, owners’ equity equals the value of the housing stock (assets) minus the debt held against it (liabilities). The fact that home equity is rising is unequivocally a good thing, but the fact that it is rising above mortgage debt outstanding doesn’t by itself tell us anything other than that household balance sheet leverage relative to wealth is declining.
The chart below corrects the Economist’s chart to include the total value of the housing assets. Hopefully this helps illustrate that American homeowners in aggregate were never underwater even at the depths of the housing market. A lot of paper value had been lost, but owners’ equity never turned negative.
The correct interpretation of the data below is important because it was something that was consistently missed during the financial crisis. A lot of Americans own their houses outright or have built up large equity stakes in their homes because they have paid down their mortgages over time. Because of this, the amount of homeowners that were underwater was frequently overstated and overestimated by analysts.
Importantly, these improper assumptions also bled through to analyst assumptions of loss rates on bank loan portfolios and, even more consequentially, on mortgage securities portfolios. The assumption was that banks would lose tremendous amounts of money on defaulted loans because all loans were so far underwater. On top of that, many analysts argued that homeowners would start walking away from their homes en mass because there was no reason to stay current on a property that was underwater. In reality, seasoned loans had low loan to values which protected banks and buoyed recovery values even when home prices fell. Additionally, most homeowners had more equity in their homes than many realized, making it totally irrational to just walk away.
One might go so far as to argue that these faulty assumptions may have even caused the financial crisis since securities analysts applied these assumptions quickly and haphazardously with devastating collateral effects because of mark-to-market accounting. When securities portfolios were marked to asset prices that were being priced with unrealistically gloomy assumptions, investment banks showed paper losses, appeared insolvent and the conditions for a bank run were formed.
Unfortunately I’ve never seen a comprehensive study of what the true total losses and default rates were on mortgage debt during the recession, but I suspect that some of the institutions that we assume were insolvent were in actuality just illiquid.
It’s worth noting that the same report from which this data is pulled (Fed Z.1) has a line item that shows the replacement value of home owner’s real estate. The number is $13.5 T vs. $19 T in market value. That’s a 28% discount to current prices. The loss of paper wealth would certainly be damaging to the economy if house prices fell to that level, but don’t be fooled, homeowners’ equity would still be positive.

Source: Flow of Funds, FRED
Related Articles

Just recently, S&P Global released its 2026 earnings estimates, which, for lack of a better word, have gone parabolic. Such should not be surprising given the ongoing...

Trump threatens EU tariffs, creates confusion about Mexico and Canada duties Dollar rebounds but gold slides again Nvidia falls in after-hours trading as earnings fail to set...

Gold Consolidates Ahead of Key US Data Releases The gold (XAU/USD) price was relatively unchanged on Wednesday as markets remained cautious ahead of upcoming inflation data and...
Are you sure you want to block %USER_NAME%?
By doing so, you and %USER_NAME% will not be able to see any of each other's Investing.com's posts.
%USER_NAME% was successfully added to your Block List
Since you’ve just unblocked this person, you must wait 48 hours before renewing the block.
I feel that this comment is:
Thank You!
Your report has been sent to our moderators for review


Add a Comment
We encourage you to use comments to engage with other users, share your perspective and ask questions of authors and each other. However, in order to maintain the high level of discourse we’ve all come to value and expect, please keep the following criteria in mind:
Enrich the conversation, don’t trash it.
Stay focused and on track. Only post material that’s relevant to the topic being discussed.
Be respectful. Even negative opinions can be framed positively and diplomatically. Avoid profanity, slander or personal attacks directed at an author or another user. Racism, sexism and other forms of discrimination will not be tolerated.
Perpetrators of spam or abuse will be deleted from the site and prohibited from future registration at Investing.com’s discretion.