Today's Highlights
Cheap Money Confirmed
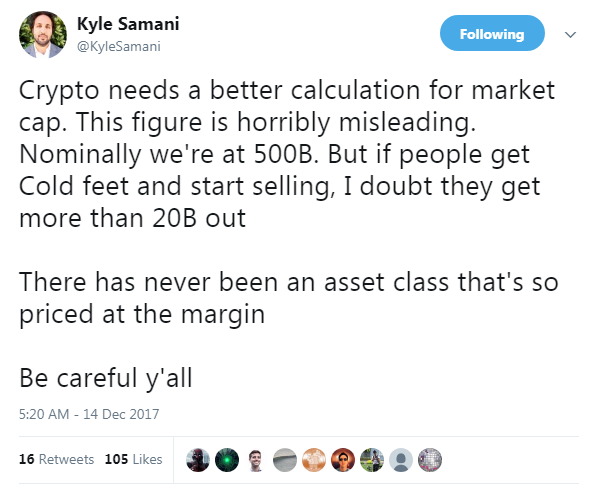
Crypto Valuation is Skewed
Bitcoin Breakout Pattern
Please note: All data, figures & graphs are valid as of December 15th. All trading carries risk. Only risk capital you can afford to lose.
Note: For those of you who are new to the markets and new readers of my daily updates, please note that I'm always putting in some information about the traditional markets before getting heavy into crypto because I firmly believe that what's happening in the macroeconomy is the main driver of the excitement in the crypto-markets and also for the reasons above regarding portfolio diversification.
Traditional Markets
Throughout the week we've heard from the top central banks in the world who have overwhelmingly confirmed that money will remain cheap for the foreseeable future.
What's new, is that now they're saying the overall economy is strong. Indeed, employment around the world has risen sharply in the past few years. Mostly due to the 'cheap money' policy that has been taken since the financial crisis of 2008.
However, many believe that all of the new money that they are introducing into the system can have potentially harmful side effects.
We can think of it as a spring. If you stretch the spring a bit, it should recoil pretty quickly when you stop stretching it. However, if you overdo it and stretch the spring too much it starts to lose it's elasticity and can never be put back to its original form.
So what they've done so far has worked. The question is, now that they are trying to gradually re-tighten the monetary system, will all the cash that's been created be absorbed or will we see gargantuan asset bubbles formed as a result.
This graph from Bloomberg shows the market cap of all the publicly traded stocks in the world. We published this chart in an update on December 5th but it seems that Bloomberg has adjusted the data since then.
Here's the screenshot from December 5th, showing the world market cap at near $100 Trillion.
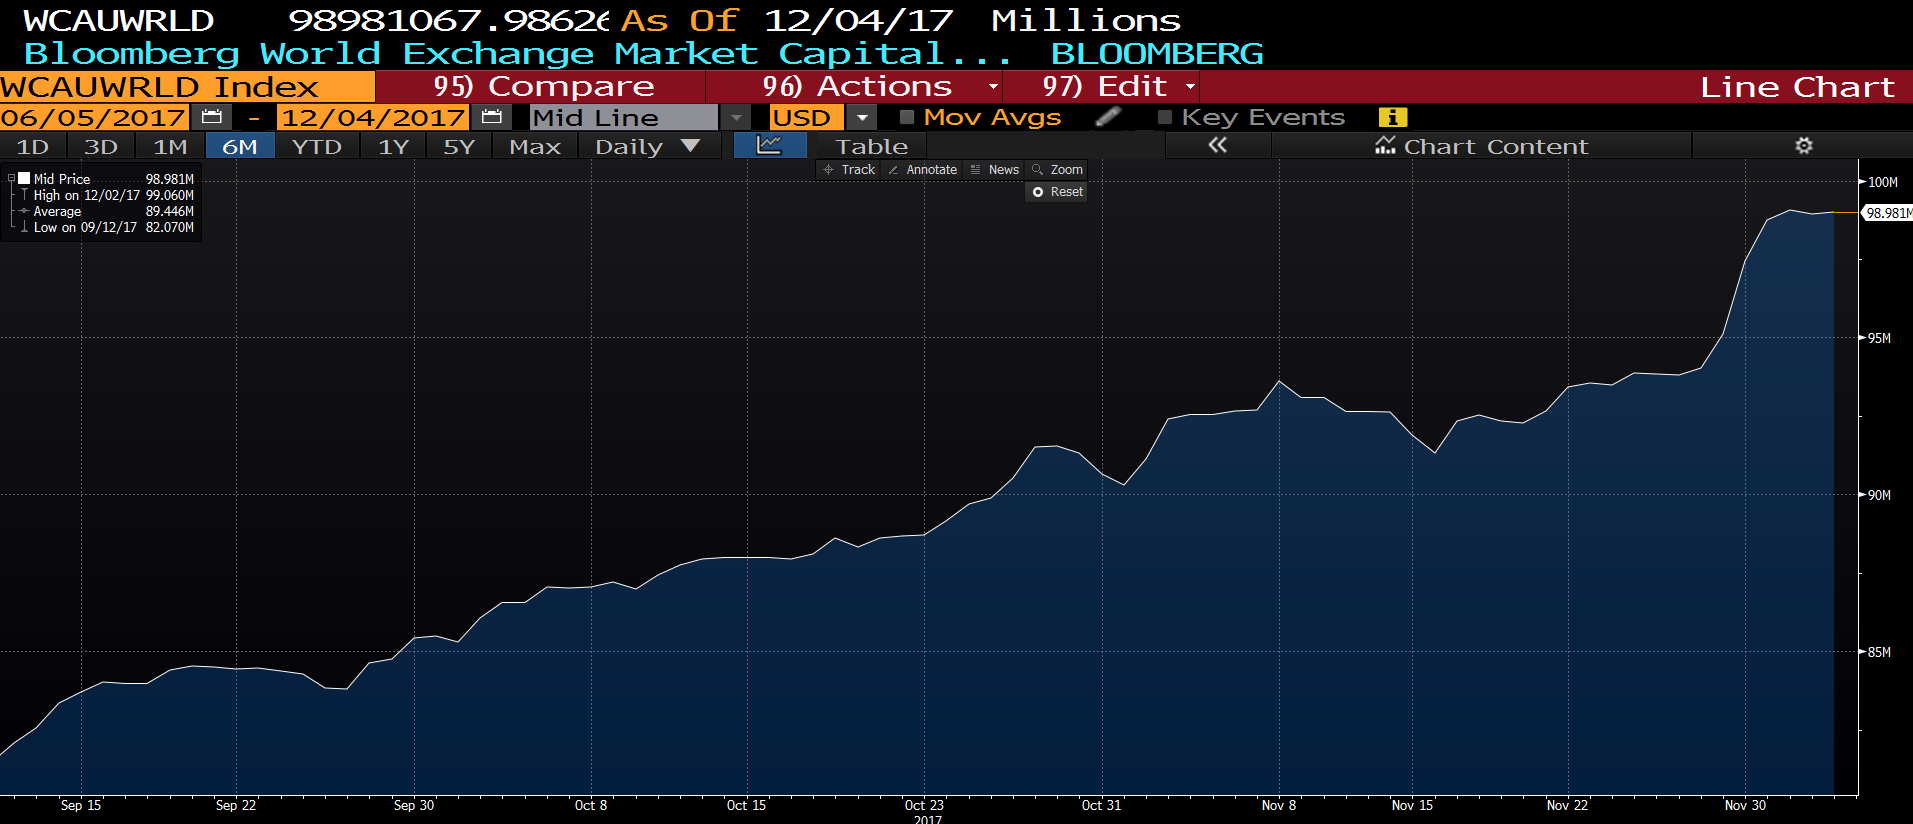
Here's a screenshot of the same chart in the Bloomberg terminal this morning.
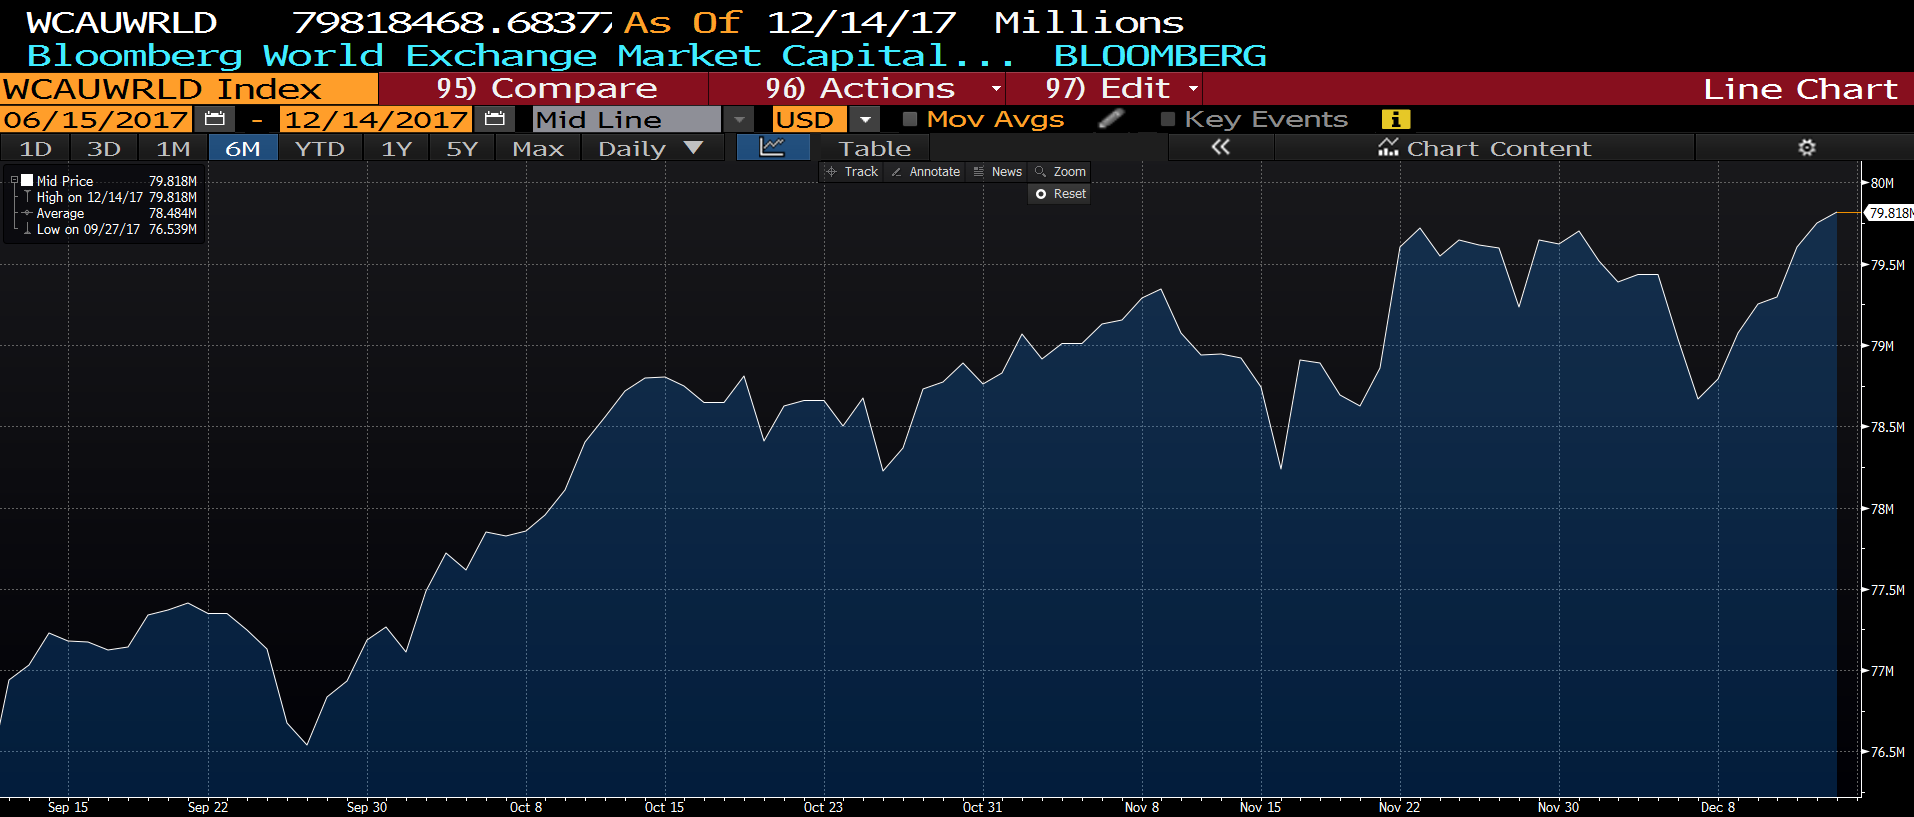
As you can see, there's a difference of about $20 trillion between the two charts. Now, I'm not sure if my blog caused them to update their data and really don't have a clue how the mechanics of compiling such stats works. What I do know, is that according to the revised graph, the stock markets of the world have risen $13 Trillion since the beginning of the year.
Given that there has been $19.5 Trillion created by the central banks over the past decade, what we're are seeing here is all that new money finding itself a home, mostly in the pockets of large corporations and their shareholders.
Crypto Valuations are Skewed
In comparison, the crypto market has risen in value by $0.5 Trillion. Which is a phenomenal gain for a market that before this year only included the most technically oriented people and is only now becoming mainstream.
Comparing crypto to stocks is not really the best metric to value the market as this article in the Wall Street Journal explains though the market cap of bitcoin is above the market cap of Visa, that doesn't mean that the bitcoin network is more widely used.
This thread on twitter is a great place to weigh in if you have any thoughts about a better way to measure the value or if you're just interested to hear other thoughts on it.
Very Little Retracement
Watching this new market grow has created incredible opportunities for new coming day traders but this is not without substantial risk. It is quite common for a single crypto to retrace by 20% or even 30%, sometimes even in a single day, which isn't good for those who got in at the top of a surge.
One good thing is that over the last few weeks we haven't seen that much of a pullback in any of the particular cryptos or from the market as a whole as new buyers continuously rush in and prop up prices.
Looking at the chart of bitcoin, we can see a breakout pattern forming just now. Notice that the last major retracement (yellow circle) took us from $17,000 to $13,000 in 4 days but has since recovered.
Now, we're seeing major resistance at the all time high (blue line) of $17,689 and if that breaks out strongly we could get a new rush of FOMO that drives the market up as much as $5000 on the next leg of this surge.
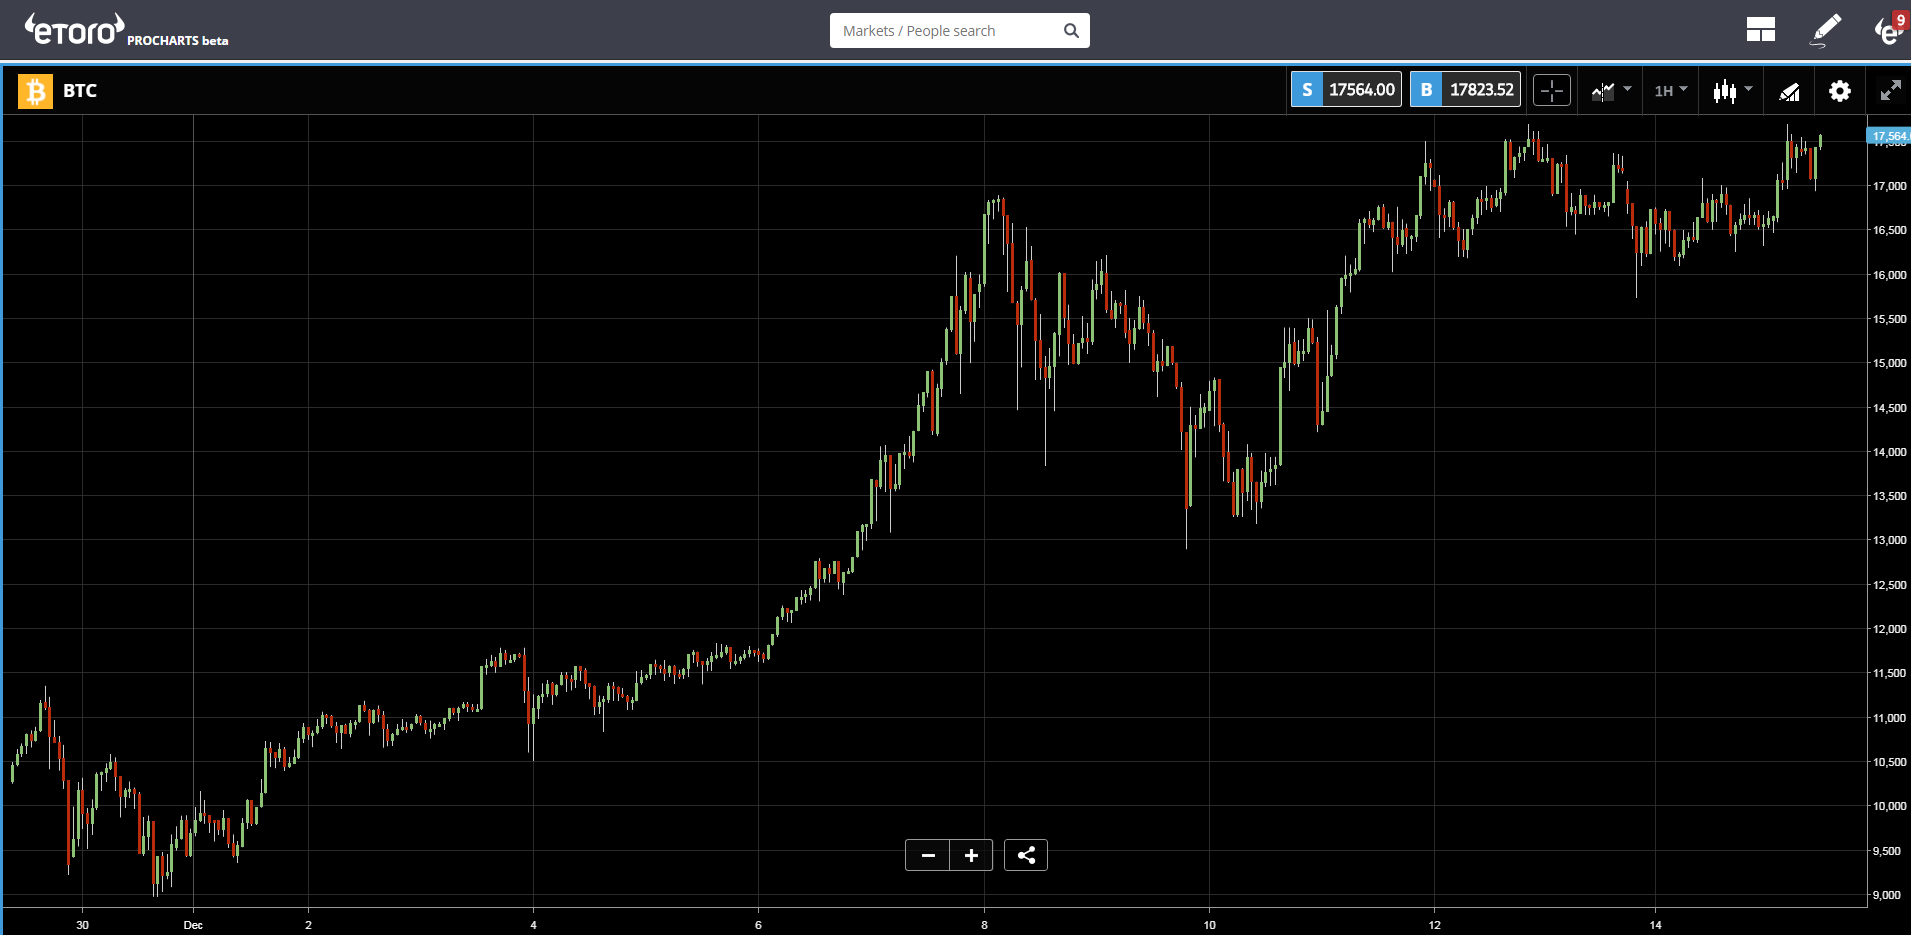
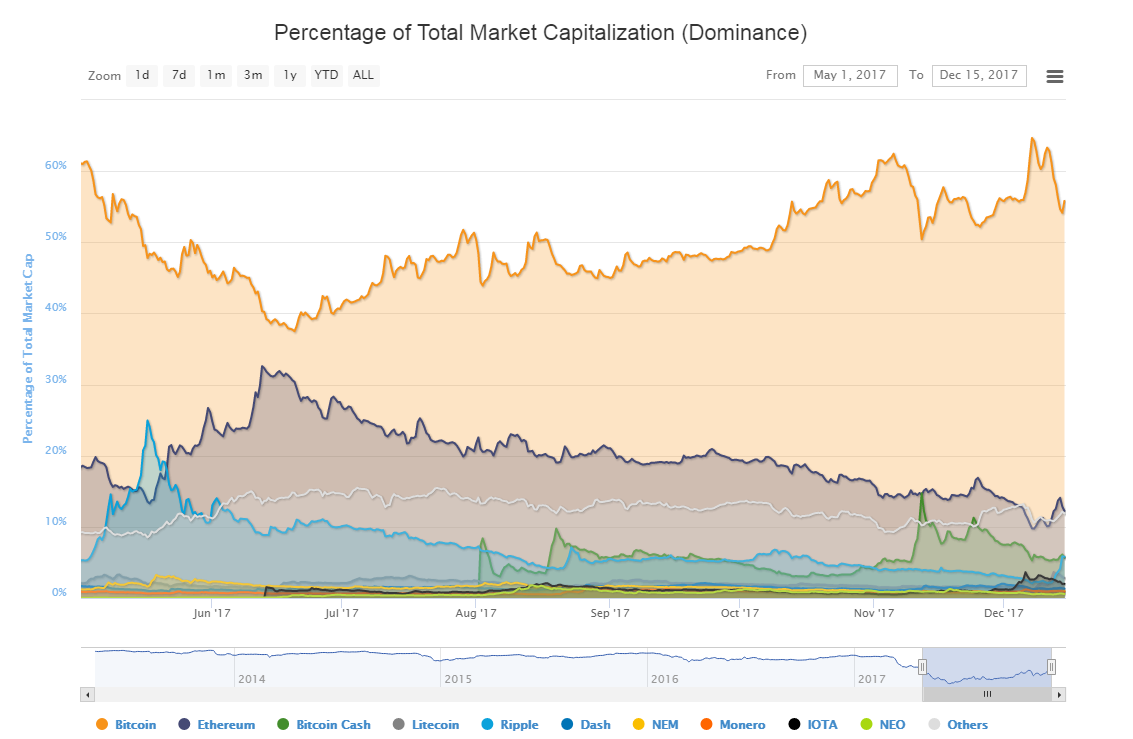
Over the last few days, we've seen the altcoins dominating and surging while bitcoin remained rather flat. Now, IF indeed we do see this kind of breakout, we could very likely see this trend reverse and bitcoin regain some more of her dominance.
Have an amazing weekend!!
eToro, Senior Market Analyst
Disclosure: This content is for information and educational purposes only and should not be considered investment advice or an investment recommendation. Past performance is not an indication of future results. All trading carries risk. Only risk capital you're prepared to lose.
