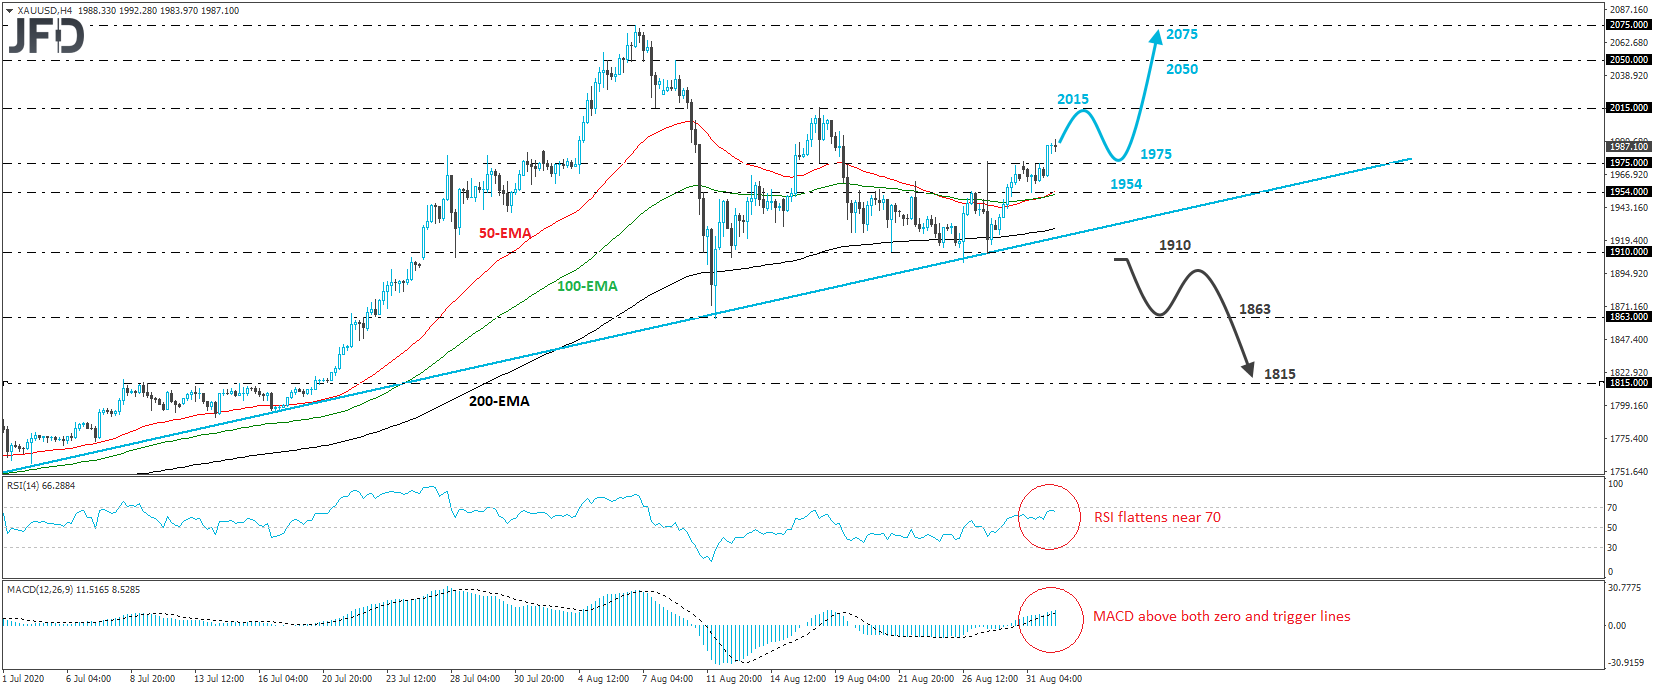
XAU/USD traded higher on Tuesday, breaking above last Thursday’s high, near the 1975 level. Overall, the precious metal continues to trade above the upside support line drawn from the low of June 16th, while since Friday, it is trading above all three of our moving averages on the 4-hour chart. All these technical signs paint a positive near-term picture in our view.
If the bulls are willing to stay behind the steering wheel, we may see them challenging the 2015 territory soon, marked by the high of August 18th. They may decide to take a break after testing that zone, thereby allowing a corrective slide. That said, as long as the metal would be trading above the aforementioned upside line, we would see decent chances for the bulls to shoot again, and perhaps push the price above 2015. Such a move would confirm a forthcoming higher high and may allow extensions towards the high of August 18th, at 2050, or even the metal’s record of 2075, hit on August 6th.
Looking at our short-term oscillators, we see that the RSI has flattened near its 70 line, while the MACD, although above both its zero and trigger lines, shows signs of flattening as well. Both indicators detect slowing upside speed and support the notion of a pullback soon before the bulls re-take charge, perhaps after the price challenges the 2015 area.
We will start considering the bearish case only if we see a strong dip below 1910, a territory that provided strong support between August 21st and 27th. The yellow metal will already be below the aforementioned upside line, something that may encourage the bears to dive towards the 1863 hurdle, defined as a support by the low of August 12th. Another dip, below 1863, could extend the decline towards the 1815 barrier, which acted as a strong resistance between July 8th and 17th.