


Sign up to create alerts for Instruments,
Economic Events and content by followed authors
Free Sign Up Already have an account? Sign In
Please try another search

GNC Holdings, Inc. (NYSE:GNC) reported fourth-quarter 2019 adjusted loss per share of 7 cents (excluding the impact of certain non-recurrring items such as increase in the valuation allowance against certain deferred tax assets and senior executives retention program), narrower than the year-ago adjusted loss per share of 13 cents. The bottom line came in significantly narrower than the Zacks Consensus Estimate of loss of 52 cents per share.
Reported loss per share for the quarter was 46 cents, marking a huge decline from earnings of 62 cents reported in the prior year.
Full-year adjusted EPScame in at 25 cents, marking a 26.4% decline from 2018.
Revenues
Revenues for the fourth quarter came in at $470.4 million, down 14.1% year over year. The top line, however, exceeded the Zacks Consensus Estimate by 1.1%. The year-over-year decline in revenues was primarily a result of the transfer of the Nutra manufacturing and China businesses to joint ventures, the closure of the company-owned stores under GNC Holding’s ongoing store portfolio-optimization strategy and a 2.4% U.S. company-owned same store sales drop.
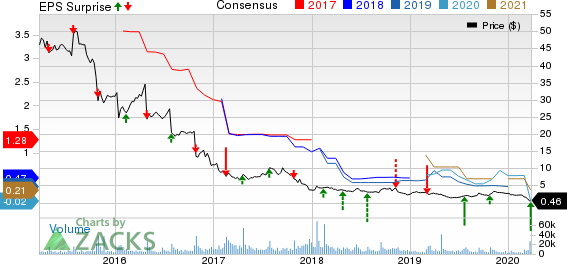
GNC Holdings, Inc. Price, Consensus and EPS Surprise
GNC Holdings, Inc. price-consensus-eps-surprise-chart | GNC Holdings, Inc. Quote
In 2019, the company registered revenues of $2.07 billion, indicating a 12.1% drop from the year-ago period. However, it topped the Zacks Consensus Estimate by a close margin of 0.5%.
Quarterly Segmental Details
GNC Holdings operates under three segments — U.S. & Canada (including company-owned stores in the United States, Puerto Rico and Canada, franchise stores in the United States, and e-commerce), International (inclusive of franchise locations in approximately 50 countries, The Health Store and China operations), and Manufacturing/Wholesale (comprising manufactured products sold to other segments, third-party contract manufacturing and sales to wholesale partners).
In the reported quarter, GNC Holdings’ revenues from the U.S. & Canada segment fell 7.3% year over year to $412.4 million. Notably, e-commerce sales accounted for 11.5% of U.S. and Canada revenues, up from the prior-year quarter’s 9.3%.
Company-owned net store closures negatively impacted revenues by $17.6 million. Further, a decline of 2.4% in U.S. company-owned same store salesled to a fall of $7.7 million in the segment’s revenues. Moreover, in domestic franchise locations, same-store sales declined 3.2% from the year-ago period.
Revenues in the International segment dipped 20.4% to $10.4 million during the reported quarter. This downside chiefly resulted from the transfer of the China business to the newly-formed joint venture (with Harbin Pharmaceutical Group Co., Ltd. or Hayao), effective Feb 13, 2019.
The Manufacturing / Wholesale segment’s revenues registered 66.78% year-over-year plunge to $17.1 million, excluding intersegment sales. This mainly resulted from the transfer of the Nutra manufacturing business to the newly-formed manufacturing joint venture with International Vitamin Corporation, effective Mar 1, 2019.
Margins
Gross profit declined 10.1% year over year to $142.1 million. However, gross margin expanded 146 basis points (bps) to 32.9% in the December-end quarter.
Selling, general and administrative expenses declined 8.7% to $138.5 million. Despite that, adjusted operating profit fell 20.8% to $16.4 million. Adjusted operating margin contracted 29 bps to 3.5%.
Financial Position
GNC Holdings exited 2019 with cash and cash equivalents of $117 million compared with $67.2 million at the end of 2018. Total long-term debt was $862.6 million in the year, down from the $1.15 billion at the end of the previous year.
Full-year net cash flow from operating activities totaled $96.5 million compared with the $95.9 million recorded in the year-ago period.
Further, the company generated full-year free cash flow of $81.4 million compared with $76.9 million in the prior-year quarter.
Our Take
GNC Holdings exited the fourth quarter of 2019 with better-than-expected numbers. However, once again, the company reported adjusted loss per share. In addition, all three operating segments posted year-over-year sales declines.
Despite the negatives, we are optimistic about the company’s solid e-commerce revenues growth driven by increased conversion rates.We are also encouraged about the company’s gross margin expansion in the quarter although the operating margin shrunk.
With regard to the global impact of the coronavirus outbreak, the company noted that currently it will evaluate all strategic alternatives to address upcoming maturities, including refinancing options in the United States and Asia.
Zacks Rank & Stocks to Consider
GNC Holdings currently carries a Zacks Rank #4 (Sell).
Some better-ranked stocks in the broader medical space are ResMed Inc. (NYSE:RMD) , Medtronic plc (NYSE:MDT) and Hill-Rom Holdings, Inc (NYSE:HRC) .
ResMed has a projected long-term earnings growth rate of 12%. It currently carries a Zacks Rank of 2 (Buy). You can see the complete list of today’s Zacks #1 Rank (Strong Buy) stocks here.
Medtronic’s long-term earnings growth rate is estimated at 7.4%. The company presently carries a Zacks Rank #2.
Hill-Rom’s long-term earnings growth rate is estimated at 11.1%. It currently carries a Zacks Rank of 2.
More Stock News: This Is Bigger than the iPhone!
It could become the mother of all technological revolutions. Apple (NASDAQ:AAPL) sold a mere 1 billion iPhones in 10 years but a new breakthrough is expected to generate more than 27 billion devices in just 3 years, creating a $1.7 trillion market.
Zacks has just released a Special Report that spotlights this fast-emerging phenomenon and 6 tickers for taking advantage of it. If you don't buy now, you may kick yourself in 2020.
Click here for the 6 trades >>
Shares of Caesars Entertainment (NASDAQ:CZR), a leading gambling stock, traded around 3% higher on Wednesday morning, though the stock was trading around 1.5% lower shortly before...
Amazon (NASDAQ:AMZN) is making a significant push into the future with a robust investment in robotics and artificial intelligence. The company has earmarked $35 billion for...
Home Depot’s (NYSE:HD) Q4 2024 report and guidance for 2025 have plenty to be unhappy about, but the simple truth is that this company turned a corner in 2024. It is on track for...
Are you sure you want to block %USER_NAME%?
By doing so, you and %USER_NAME% will not be able to see any of each other's Investing.com's posts.
%USER_NAME% was successfully added to your Block List
Since you’ve just unblocked this person, you must wait 48 hours before renewing the block.
I feel that this comment is:
Thank You!
Your report has been sent to our moderators for review
Add a Comment
We encourage you to use comments to engage with other users, share your perspective and ask questions of authors and each other. However, in order to maintain the high level of discourse we’ve all come to value and expect, please keep the following criteria in mind:
Enrich the conversation, don’t trash it.
Stay focused and on track. Only post material that’s relevant to the topic being discussed.
Be respectful. Even negative opinions can be framed positively and diplomatically. Avoid profanity, slander or personal attacks directed at an author or another user. Racism, sexism and other forms of discrimination will not be tolerated.
Perpetrators of spam or abuse will be deleted from the site and prohibited from future registration at Investing.com’s discretion.