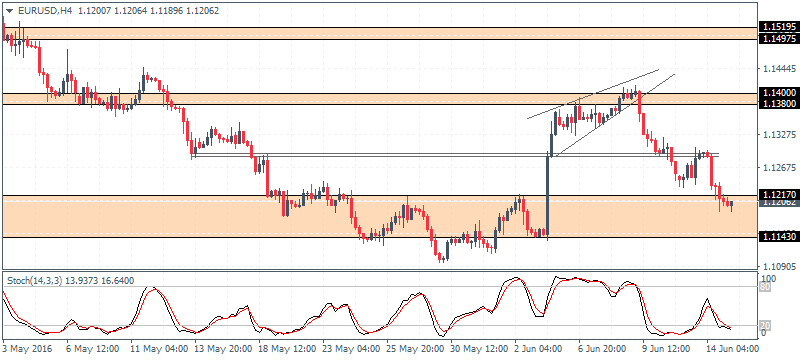
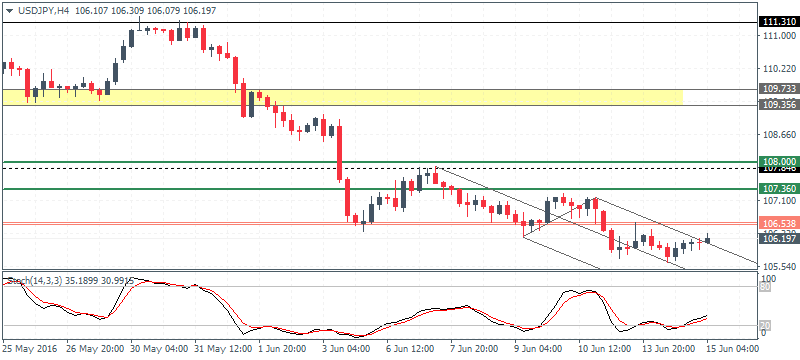
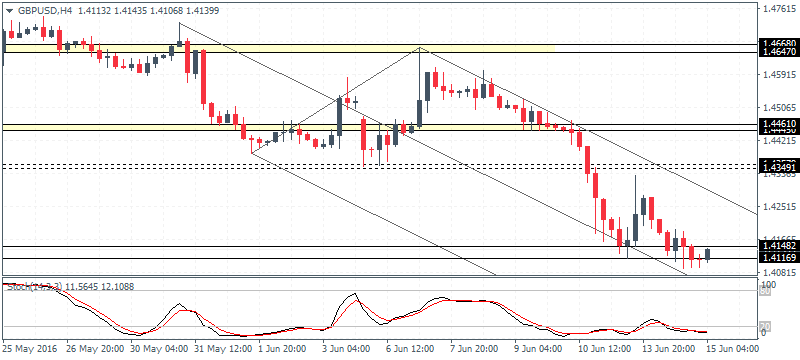
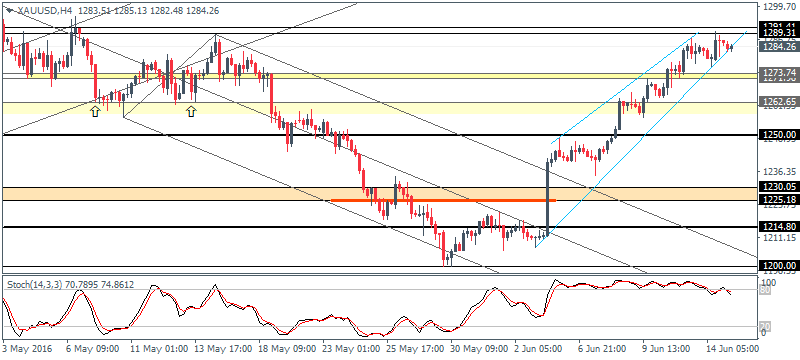
The Federal Reserve will be releasing its monetary policy statement, economic projections and holding a press conference later today. The markets remain jittery ahead of the meeting, but the attention is on USD/JPY, which will later see the BoJ meeting early tomorrow. EUR/USD is showing signs of a recovery to 1.138 – 1.140 while GBP/USD looks poised for a short-term retracement to 1.44. Gold has stalled near 1289 – 1290 levels but risks a decline to 1220 – 1230 levels.
EUR/USD Daily Analysis

EUR/USD (1.120): EUR/USD fell to 1.120 support yesterday, and price action shows that we could expect to see a bounce off this level. The upside is limited with the bounce off 1.120 likely to see EUR/USD retrace back to 1.1380 - 1.140 which will mark a correction and also establish resistance at the level which was briefly tested earlier in June. To the downside, below 1.120, the next main support comes in at 1.110. Above 1.140, EUR/USD could see further gains but could move sideways within 1.14975 - 1.1520 resistance level.
USD/JPY Daily Analysis

USD/JPY (106.1): USD/JPY has been trading within 106.27 - 105.60 support for the past two days with prices being rejected near the lower end of the support. Any bounce off this support could see USD/JPY test the resistance near 108.0 - 107.850 levels. On the 4-hour chart, price action is showing signs of shifting bias to the upside, but will be valid only on a close above the minor resistance at 106.5 - 106.70 level. To the downside, a close below 105.60 could see USD/JPY slide lower to 105.35 - 105.00 support.
GBP/USD Daily Analysis

GBP/USD (1.413): GBP/USD extended its declines yesterday, but prices managed to close above the previous day's doji low at 1.4115. We could, therefore, expect to see a follow through here, with a close above 1.420 likely to see a near term rally towards 1.44250 to establish resistance on what was a support level previously. To the downside, in the event of a break below 1.4115, further declines are seen towards 1.40530 support. On the 4-hour chart, GBP/USD has marked a reversal with a doji and a close above 1.41482 could signal a near-term retracement in GBP/USD.
Gold Daily Analysis

XAU/USD (1284): Gold prices continue to remain biased to the upside with prices posting a high above 1289 yesterday. A follow through here could see gold prices likely to push higher on a close above 1290 - 1300 level, but the strong momentum led rally is likely to show signs of exhaustion. To the downside, support at 1230 - 1220 remains key to validate any further moves to the upside. With prices trading at resistance, gold could see a near term correction lower with minor support levels at 1273 - 1271 followed by the 1250 psychological support.
