After the VIX temporarily broke above the 15 handle in mid-April, the US stock market was quickly restored to a low-VIX environment in the second quarter of 2017. In a remarkable display of fearlessness, the VIX index closed below 10 four times in the past month – and the VIX has closed below 10 only ten times since 1990. Moreover, if we start the history from 2004, when the CBOE adopted the new methodology of calculating VIX, the fear index has closed below 10 only once since then – on Jan 24th, 2007. We all know what happened in the year following January 2007. Should we fear that history will repeat itself now?
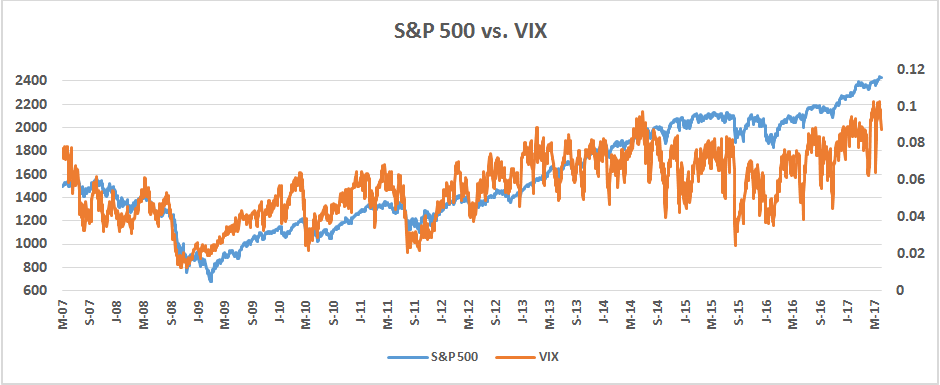
We have argued in an earlier commentary that VIX has succumbed to Goodhart’s Law and lost its predictive power. Following the strategy “Buy when VIX is high, sell when VIX is low” will no longer be effective. This is because of a common misconception among many investors: that VIX is a leading rather than a contemporaneous indicator of the equity market. However, VIX does not lead the future market direction, as we see in Figure 1.
Both in the drastic drawdowns during the financial crisis and in the uptrend over the course of the current bull market, VIX has reacted instantaneously to market movements. However, the correlation does not translate into future forecasting power. Why? Sudden changes in VIX can be event-driven; and if the market pricing overreacts to events, then VIX probably overreacts as well. Hence, VIX is not a reliable forecasting tool.
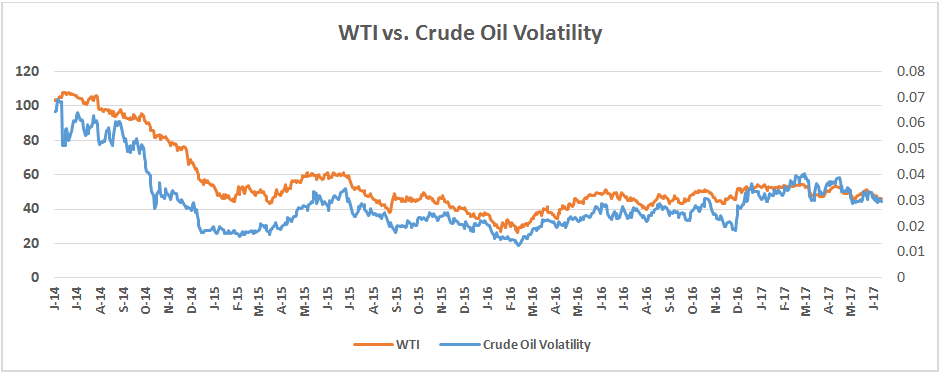
Similar correlations can be found across other asset classes. For example, the WTI Crude Oil price and the CBOE Crude Oil Volatility have been moving in sync since the oil price topped in the summer of 2014. Figure 2 shows the high correlation in their co-movement as well as OVX’s lack of predictive power. While the crude oil price is more affected by supply and demand than stock prices are, volatility indexes across various assets have shown signs of being victims of Goodhart’s Law. 
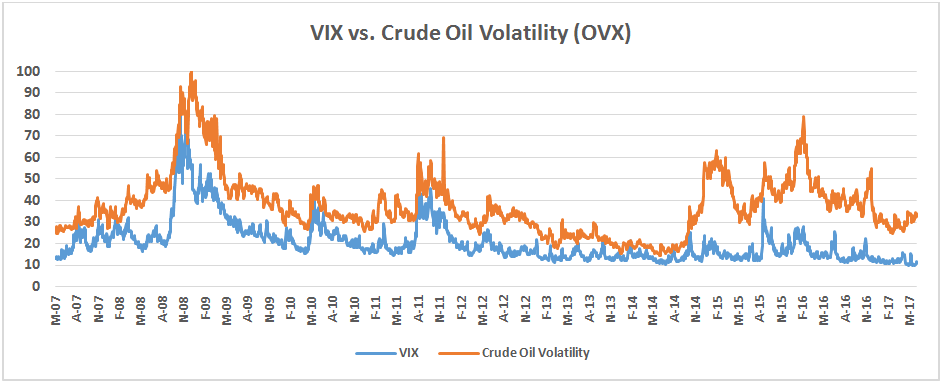
Some keen market participants have observed the decoupling of asset correlations in recent months. We still vividly remember that the stock market tumbled sharply when the crude oil price dipped below $30 a barrel in January and February of 2016. The two asset classes were synchronized at the time. We argued that that type of co-movement happens under extreme market conditions. As asset prices consolidate, the high correlation fades. However, while these asset classes have unstable correlations over time, the underlying volatilities remain relatively correlated, as demonstrated in Figure 3. 
In summary, the current low-volatility market appears set to persist until the next exogenous shock occurs, although the next spike in VIX may once again be transitory.
Index returns are for illustrative purposes only and do not represent actual portfolio performance. One cannot invest directly in an index.
