


Sign up to create alerts for Instruments,
Economic Events and content by followed authors
Free Sign Up Already have an account? Sign In
Please try another search

Value investing is easily one of the most popular ways to find great stocks in any market environment. After all, who wouldn’t want to find stocks that are either flying under the radar and are compelling buys, or offer up tantalizing discounts when compared to fair value?
One way to find these companies is by looking at several key metrics and financial ratios, many of which are crucial in the value stock selection process. Let’s put Eastman Chemical Company (NYSE:EMN) stock into this equation and find out if it is a good choice for value-oriented investors right now, or if investors subscribing to this methodology should look elsewhere for top picks:
PE Ratio
A key metric that value investors always look at is the Price to Earnings Ratio, or PE for short. This shows us how much investors are willing to pay for each dollar of earnings in a given stock, and is easily one of the most popular financial ratios in the world. The best use of the PE ratio is to compare the stock’s current PE ratio with: a) where this ratio has been in the past; b) how it compares to the average for the industry/sector; and c) how it compares to the market as a whole.
On this front, Eastman Chemical has a trailing twelve months PE ratio of 12.4. This level compares pretty favorably with the market at large, as the PE ratio for the S&P 500 comes in at about 20.7.
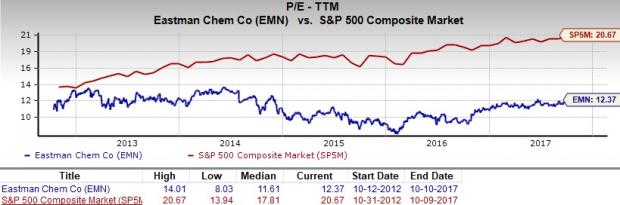
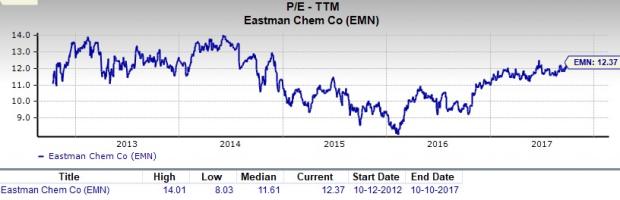
If we focus on the long-term trend of the stock the current level puts Eastman Chemical’s current PE above its median over the observed period (which stands at 11.6x). Hence, we could infer that the stock is overvalued in this respect, especially in light of its historical trend.
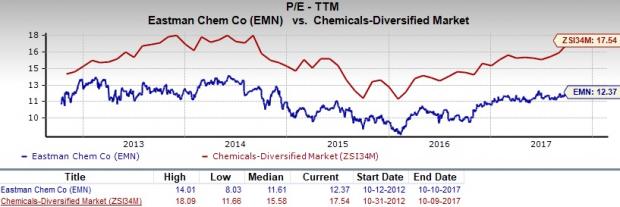
Nevertheless, the stock’s PE compares favorably with its industry’s trailing twelve months PE ratio, which stands at 17.5. At the very least, this indicates that the stock is relatively undervalued right now, compared to its peers.
We should also point out that Eastman Chemical has a forward PE ratio (price relative to this year’s earnings) of 12.1 – lower than the current level. So, it is fair to say that a slightly more value-oriented path may be ahead for Eastman Chemical stock in the near term.
PS Ratio
Another key metric to note is the Price/Sales ratio. This approach compares a given stock’s price to its total sales, where a lower reading is generally considered better. Some people like this metric more than other value-focused ones because it looks at sales, something that is far harder to manipulate with accounting tricks than earnings.
Right now, Eastman Chemical has a P/S ratio of about 1.4. This is lower than the industry average, which comes in at 1.7x right now.
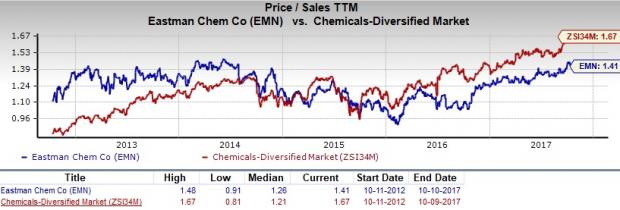
EMN is actually in the higher zone of its trading range in the time period per the P/S metric, which suggests that the company’s stock price has already appreciated to some degree, relative to its sales.
Broad Value Outlook
In aggregate, Eastman Chemical currently has a Value Score of A, putting it into the top 20% of all stocks we cover from this look. This makes Eastman Chemical a solid choice for value investors, and some of its other key metrics make this pretty clear too.
For example, the PEG ratio for Eastman Chemical is just 1.4, a level that is lower than the industry average of 2. The PEG ratio is a modified PE ratio that takes into account the stock’s earnings growth rate. Additionally, its P/CF ratio (another great indicator of value) comes in at 8.3, which is far better than the industry average of 11.6. Clearly, EMN is a solid choice on the value front from multiple angles.
What About the Stock Overall?
Though Eastman Chemical might be a good choice for value investors, there are plenty of other factors to consider before investing in this name. In particular, it is worth noting that the company has a Growth grade of B and a Momentum score of D. This gives EMN a Zacks VGM score—or its overarching fundamental grade—of B. (You can read more about the Zacks Style Scores here >>).
Meanwhile, the company’s earnings estimates have been mixed at best. The current quarter has seen four estimates go higher in the past sixty days compared to two lower, while the full year estimate has seen three upward revisions and one downward revision in the same time period.
This has had a small impact on the consensus estimate though as the current quarter consensus estimate has increased 0.5% in the past two months, while the full year estimate has inched lower by 0.4%. You can see the consensus estimate trend and recent price action for the stock in the chart below:
Eastman Chemical Company Price and Consensus
The somewhat mixed trend is why the stock has just a Zacks Rank #3 (Hold) despite strong value metrics and why we are looking for in-line performance from the company in the near term.
Bottom Line
Eastman Chemical is an inspired choice for value investors, as it is hard to beat its incredible lineup of statistics on this front.
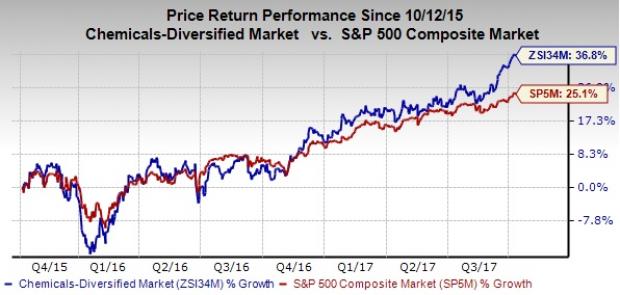
It boasts a favorable industry rank – among the top 24% out of more than 250 industries. In fact, over the past two years, the industry has clearly outperformed the broader market, as you can see below:
Meanwhile, Eastman Chemical remains focused on cost-cutting and productivity actions amid a challenging operating environment. Further, the company should gain from its strategic acquisitions and capacity expansion actions. It also remains committed to reduce debt and boost shareholder returns leveraging healthy free cash flows.
However, Eastman Chemical continues to face pricing pressure. The company is also exposed to weakness in its Fibers unit and raw material price volatility. A Zacks Rank #3 also dims the sparkle on the company as of now.
So, value investors might want to wait for analyst sentiment to turn around in this name first, but once that happens, this stock could be a compelling pick.
Wall Street’s Next Amazon (NASDAQ:AMZN)
Zacks EVP Kevin Matras believes this familiar stock has only just begun its climb to become one of the greatest investments of all time. It’s a once-in-a-generation opportunity to invest in pure genius.
Nvidia’s muted reaction keeps tech on edge, with chipmakers in focus. Nasdaq’s 20980-21000 support holds—for now. A break could mean trouble. With Nvidia done, GDP today and...
Nvidia’s earnings beat didn’t erase investor concerns over slowing growth. Soft Q1 guidance and valuation worries may limit the stock’s upside. Weak network and gaming sales...
Shares of Etsy (NASDAQ:ETSY) are down approximately 7% since the company reported earnings on February 19. Concerns over slowing growth are overriding revenue and earnings that...
Are you sure you want to block %USER_NAME%?
By doing so, you and %USER_NAME% will not be able to see any of each other's Investing.com's posts.
%USER_NAME% was successfully added to your Block List
Since you’ve just unblocked this person, you must wait 48 hours before renewing the block.
I feel that this comment is:
Thank You!
Your report has been sent to our moderators for review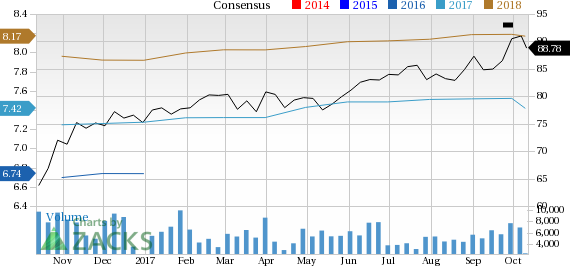

Add a Comment
We encourage you to use comments to engage with other users, share your perspective and ask questions of authors and each other. However, in order to maintain the high level of discourse we’ve all come to value and expect, please keep the following criteria in mind:
Enrich the conversation, don’t trash it.
Stay focused and on track. Only post material that’s relevant to the topic being discussed.
Be respectful. Even negative opinions can be framed positively and diplomatically. Avoid profanity, slander or personal attacks directed at an author or another user. Racism, sexism and other forms of discrimination will not be tolerated.
Perpetrators of spam or abuse will be deleted from the site and prohibited from future registration at Investing.com’s discretion.